hh_hl_structure
HH/HL Trend Structure
Detects trend structure shifts using swing highs and lows. Bullish: last two swing highs form a Higher High (exceeding z-score tolerance), then price pulls back to form a Higher Low above the previous swing low, confirmed after 5 bars. Bearish is the mirror (Lower Low + Lower High). Z-score tolerance adapts to each stock's volatility — tighter for low-vol, looser for high-vol stocks.
Signal family
Pattern — Formal chart-pattern detectors (double tops / bottoms, failed breakouts, HH/HL structure).
Parameters
| Name | Description | Default | Range |
|---|---|---|---|
| swing_window | Swing detection window (bars each side) | 10 | 3–30 |
| confirmation_window | Confirmation window for forming HL/LH | 1 | 1–15 |
| tolerance_zscore | Min HH/LL move (z-scores of daily vol) | 1.5 | 0.5–4.0 |
| vol_window | Volatility computation window | 252 | 60–504 |
| lookback | Lookback window (bars) | 252 | 60–504 |
Historical context
550,314 triggers on 23,363 tickers, 1996-07-30 → 2026-05-01. Universe: US large-cap (mcap ≥ $100,000,000, price ≥ $1). Long-only convention: BUY at open T+1, hold the horizon, compare to S&P 500 Equal Weight over the same window.
Methodology footnotes
Benchmarks shown in the detail tables: spxew (S&P 500 Equal Weight — primary, median-stock view, avoids the 2020+ megacap-concentration distortion), spx (S&P 500 cap-weighted, distorted post-2020), msci (MSCI World USD). Per-stock regime tags: trending = ADX(14) ≥ 25, high vol = 20d realized annualized vol ≥ 20%. 1d return = intraday T+1 open→close; 20d = open T+1 to close T+20.
At a glance — alpha vs S&P 500 Equal Weight, US-only
Holding-period sensitivity. Bullish columns: positive = signal worked (long the trigger beat the index). Bearish columns: negative = signal worked (the flagged stock underperformed).
| Horizon | Bullish α | Bearish α |
|---|---|---|
| 5-day | -0.24% | -0.29% |
| 20-day | -0.33% | +0.13% |
| 60-day | -0.03% | +0.28% |
| 1-year | +3.21% | +1.10% |
Sign flip across horizons. Bullish triggers go from -0.24% (5d) to +3.21% (1y) — short-term fade but longer holding recovers and wins. Bearish triggers go from -0.29% (5d) to +1.10% (1y) — short-term works as a sell signal but at 1-year horizon stocks mean-revert and outperform.
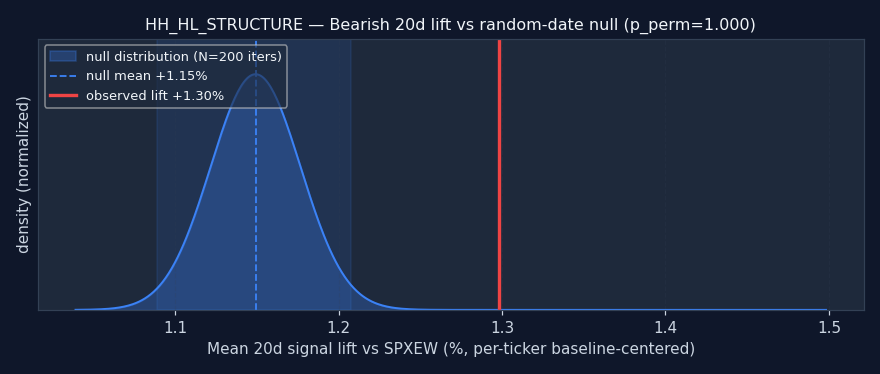
Bearish: worse than random (p=1.000).
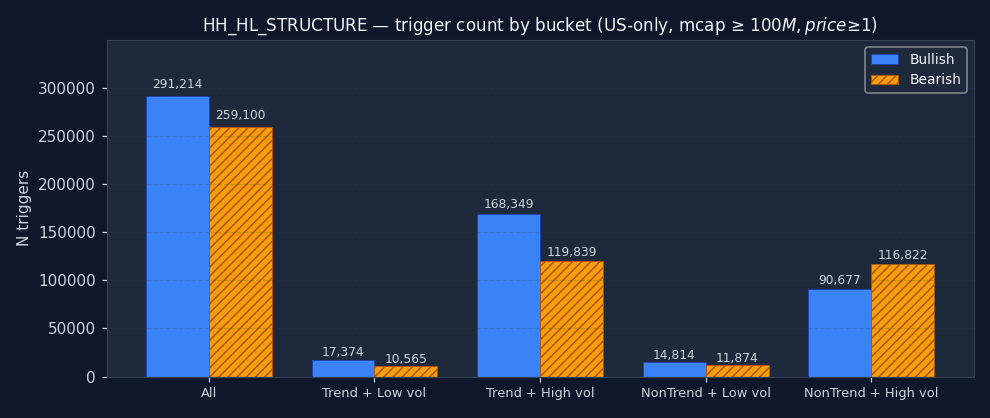
Where does HH_HL_STRUCTURE actually fire?
The bucket distribution often reveals what the signal really is, regardless of its textbook label. Heavy concentration in "non-trending + high vol" = it's mostly a chop-market event. Heavy in "trending + low vol" = it picks up the smooth grinds. Read the chart before the alpha numbers — context shapes everything that follows.
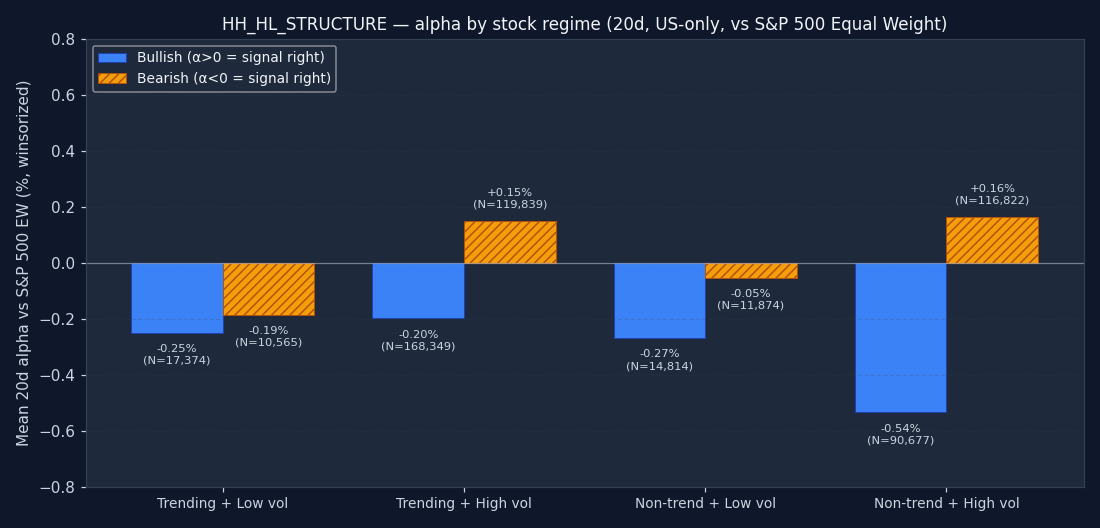
Does it work in every regime?
Trigger alpha split by the host stock's own regime on the trigger date — trending or ranging, high-vol or low-vol. The 20d alpha you'd actually capture if you took the trade. Bars matching your direction's "right" sign (green) = the signal worked in that regime; opposite sign = avoid it there. A signal with one strong-positive bar and three flat ones isn't a "20d alpha" signal — it's a "20d alpha when the stock is X" signal.
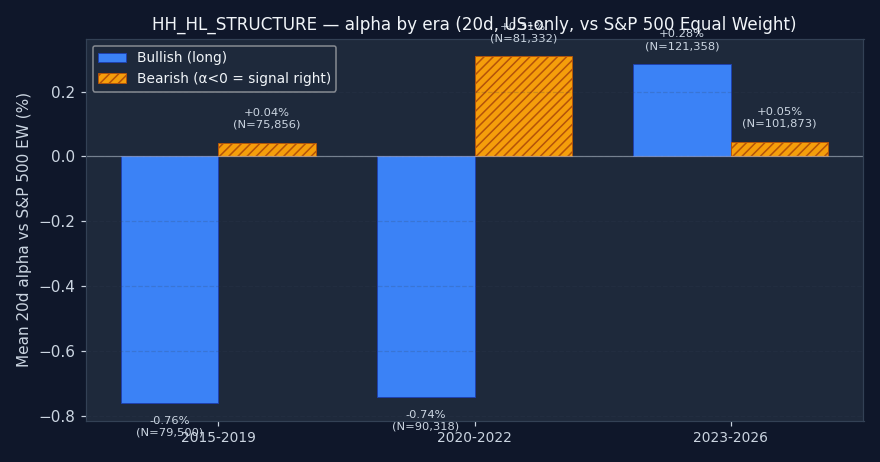
Does it work in every era?
A multi-year average can hide major instability. The sample splits into three windows: 2015–2019 (pre-COVID), 2020–2022 (pandemic + 2022 bear), and 2023+ (post-ZIRP + AI megacap rally). All three matching your direction's "right" sign = the signal is durable. One era doing all the work = a regime-specific edge that may not repeat. The bigger the variance across eras, the smaller the position you should run.
↑ Bullish triggers
| Bench | Metric | 1d | 5d | 20d | 60d | 252d |
|---|---|---|---|---|---|---|
| spx | Stock % | +0.11% | -0.07% | +0.38% | +2.31% | +13.13% |
| Bench % | +0.02% | +0.21% | +1.01% | +3.19% | +13.78% | |
| Alpha % | +0.08% | -0.27% | -0.59% | -0.90% | -0.69% | |
| Median alpha | -0.01% | -0.35% | -1.43% | -3.27% | -9.96% | |
| Hit rate (α>0) | 49.8% | 46.1% | 43.1% | 41.5% | 38.7% | |
| p (naive) | <0.001 | <0.001 | <0.001 | <0.001 | <0.001 | |
| p (HAC) | <0.001 | <0.001 | <0.001 | <0.001 | 0.0038 | |
| N | 283,315 | 275,282 | 275,661 | 266,944 | 234,090 | |
| msci | Stock % | +0.11% | -0.07% | +0.38% | +2.31% | +13.13% |
| Bench % | +0.07% | +0.24% | +0.90% | +2.78% | +11.35% | |
| Alpha % | +0.03% | -0.29% | -0.48% | -0.46% | +1.65% | |
| Median alpha | -0.06% | -0.39% | -1.35% | -2.86% | -7.50% | |
| Hit rate (α>0) | 48.6% | 45.7% | 43.4% | 42.4% | 41.2% | |
| p (naive) | <0.001 | <0.001 | <0.001 | <0.001 | <0.001 | |
| p (HAC) | <0.001 | <0.001 | <0.001 | <0.001 | <0.001 | |
| N | 282,570 | 274,398 | 274,087 | 264,321 | 232,578 | |
| spxew | Stock % | +0.11% | -0.07% | +0.38% | +2.31% | +13.13% |
| Bench % | +0.05% | +0.17% | +0.77% | +2.38% | +10.02% | |
| Alpha % | +0.04% | -0.24% | -0.33% | -0.03% | +3.21% | |
| Median alpha | -0.03% | -0.31% | -1.12% | -2.31% | -5.98% | |
| Hit rate (α>0) | 49.2% | 46.6% | 44.5% | 43.8% | 42.8% | |
| p (naive) | <0.001 | <0.001 | <0.001 | 0.4952 | <0.001 | |
| p (HAC) | <0.001 | <0.001 | <0.001 | 0.5641 | <0.001 | |
| N | 281,645 | 272,294 | 272,678 | 263,097 | 231,365 |
Permutation null detail — all horizons × both benchmarks
| Horizon | Bench | Observed lift | Null mean | Null 95% CI | pperm |
|---|---|---|---|---|---|
| 1d | spx | +0.19% | +0.08% | [+0.07%, +0.09%] | 0.005 |
| 1d | msci | +0.18% | +0.09% | [+0.08%, +0.10%] | 0.005 |
| 1d | spxew | +0.17% | +0.08% | [+0.06%, +0.09%] | 0.005 |
| 5d | spx | +0.10% | +0.35% | [+0.33%, +0.38%] | 1.000 |
| 5d | msci | +0.08% | +0.36% | [+0.34%, +0.39%] | 1.000 |
| 5d | spxew | +0.09% | +0.34% | [+0.32%, +0.36%] | 1.000 |
| 20d | spx | +0.52% | +1.13% | [+1.09%, +1.18%] | 1.000 |
| 20d | msci | +0.53% | +1.15% | [+1.10%, +1.20%] | 1.000 |
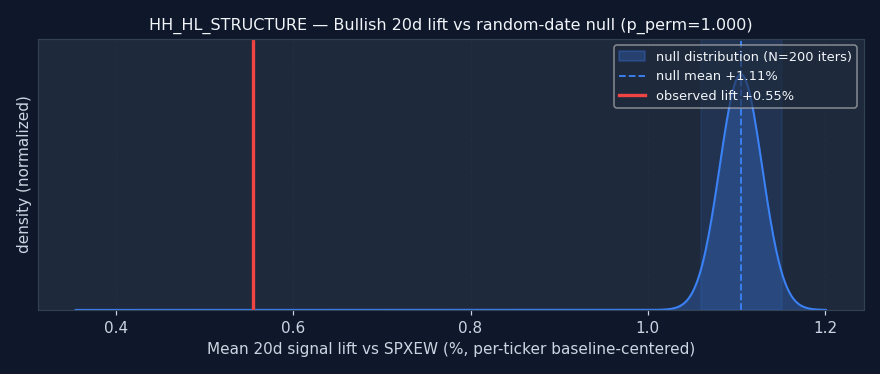
| 20d | spxew | +0.55% | +1.11% | [+1.06%, +1.15%] | 1.000 |
| 60d | spx | +1.40% | +2.44% | [+2.37%, +2.52%] | 1.000 |
| 60d | msci | +1.43% | +2.47% | [+2.40%, +2.53%] | 1.000 |
| 60d | spxew | +1.52% | +2.38% | [+2.31%, +2.45%] | 1.000 |
| 252d | spx | +3.55% | +4.92% | [+4.79%, +5.05%] | 1.000 |
| 252d | msci | +3.54% | +4.87% | [+4.73%, +4.99%] | 1.000 |
| 252d | spxew | +3.31% | +4.58% | [+4.45%, +4.71%] | 1.000 |
Example triggers on US large-caps (2023+, mcap ≥ $30B)
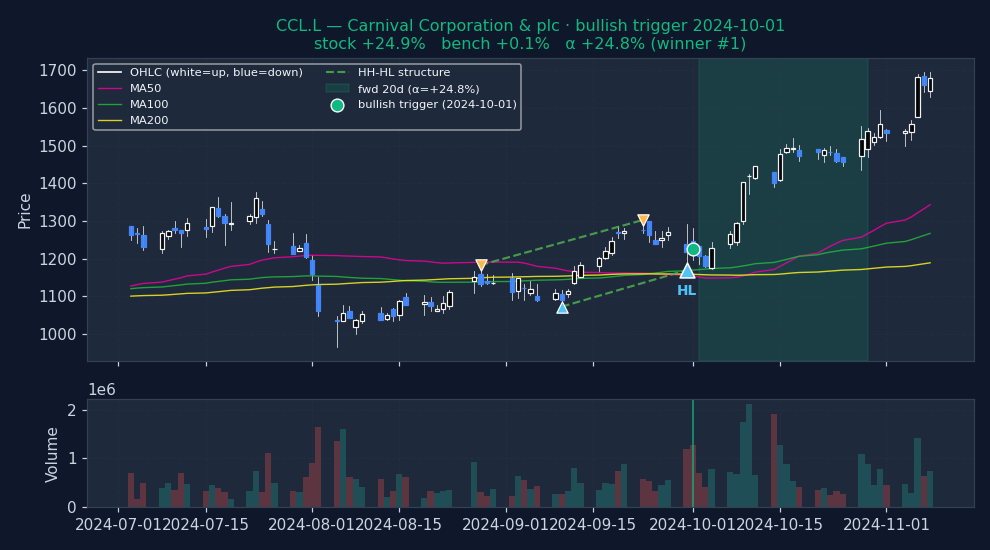
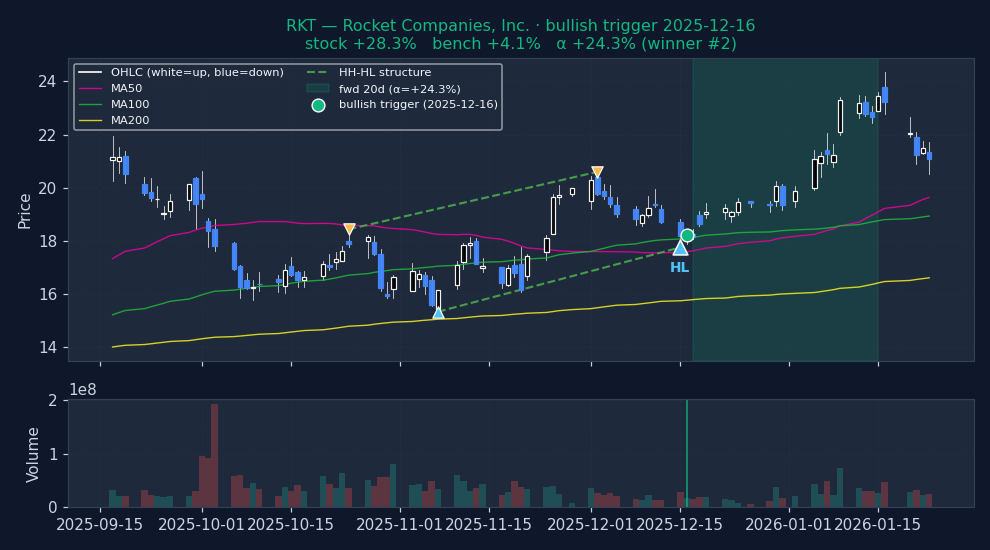
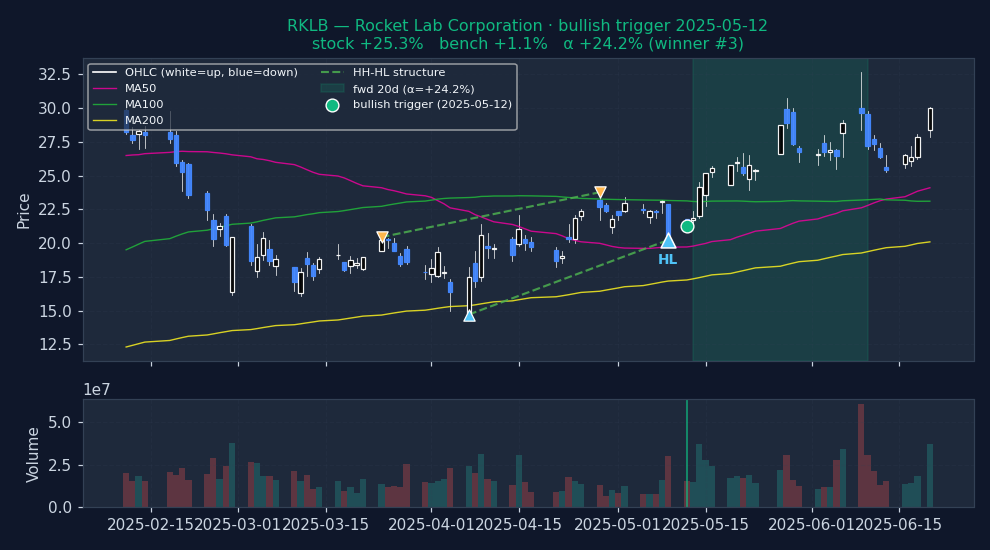
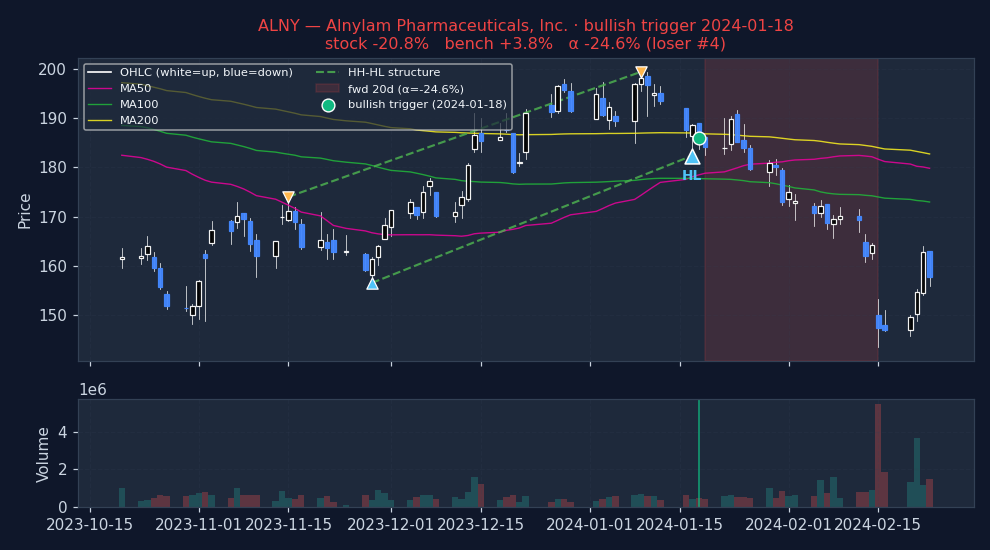
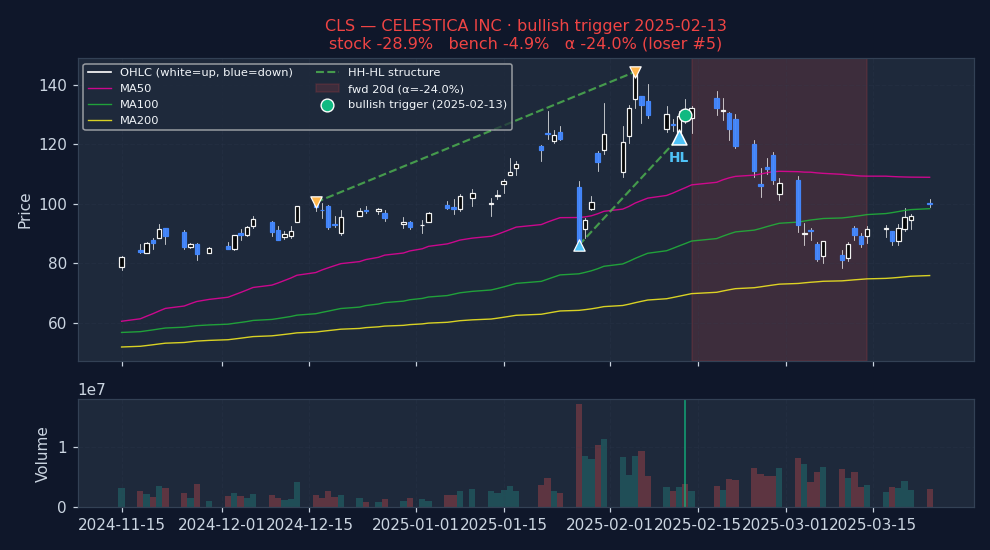
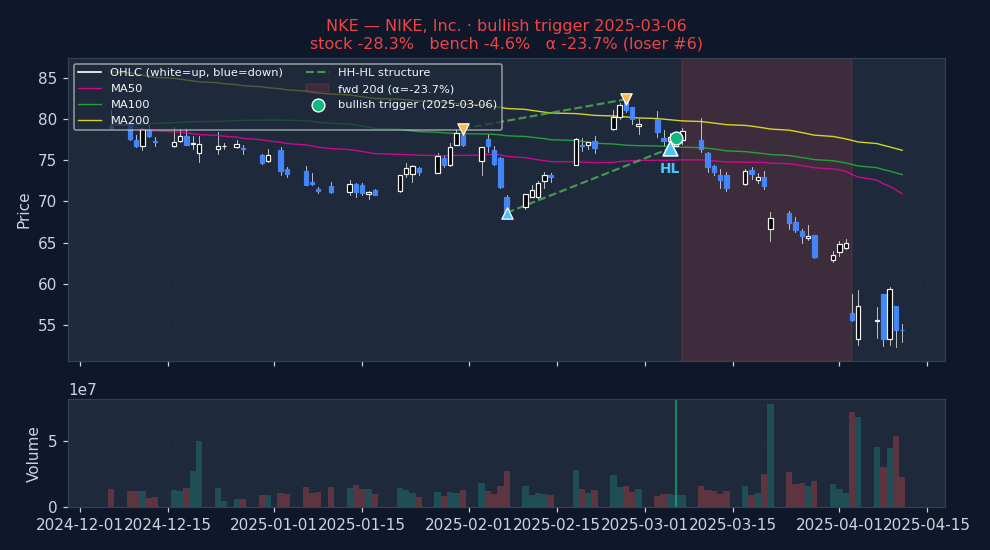
Six recent bullish HH_HL_STRUCTURE triggers on US mega-caps. Top three: the signal's best outcomes. Bottom three: the worst. Catalyst-driven outliers (|α| > 25%) excluded so what's left is the signal's own typical good and bad days, not earnings shocks.
Strongest outcomes (what HH_HL_STRUCTURE looks like when it works)
Weakest outcomes (what HH_HL_STRUCTURE looks like when it fails)
Stock-regime quadrants (2×2 per-stock, 20d alpha detail table)
| Quadrant | N | Stock % (spx) | Bench % (spx) | Alpha % (spx) | p (HAC) | Stock % (msci) | Bench % (msci) | Alpha % (msci) | p (HAC) | Stock % (spxew) | Bench % (spxew) | Alpha % (spxew) | p (HAC) |
|---|---|---|---|---|---|---|---|---|---|---|---|---|---|
| Trending + Low vol Clean directional grind, low whipsaw | 17,374 | +0.17% | +0.81% | -0.62% | <0.001 | +0.17% | +0.69% | -0.50% | <0.001 | +0.17% | +0.45% | -0.25% | <0.001 |
| Trending + High vol Crisis selloff or parabolic rally | 168,349 | +0.49% | +1.03% | -0.48% | <0.001 | +0.49% | +0.90% | -0.34% | <0.001 | +0.49% | +0.76% | -0.20% | <0.001 |
| Non-trending + Low vol Quiet chop, summer doldrums | 14,814 | +0.17% | +0.76% | -0.56% | <0.001 | +0.17% | +0.64% | -0.43% | <0.001 | +0.17% | +0.49% | -0.27% | <0.001 |
| Non-trending + High vol Classical "whipsaw zone" for momentum | 90,677 | +0.29% | +1.07% | -0.76% | <0.001 | +0.29% | +0.98% | -0.68% | <0.001 | +0.29% | +0.88% | -0.54% | <0.001 |
Sub-period breakdown table (20d alpha)
| Period | N | Alpha % (spx) | p (HAC) | Alpha % (msci) | p (HAC) | Alpha % (spxew) | p (HAC) |
|---|---|---|---|---|---|---|---|
| 2015-2019 2015-01-01 → 2020-01-01 | 79,500 | -0.95% | <0.001 | -0.81% | <0.001 | -0.76% | <0.001 |
| 2020-2022 2020-01-01 → 2023-01-01 | 90,318 | -0.58% | <0.001 | -0.49% | <0.001 | -0.74% | <0.001 |
| 2023-2026 2023-01-01 → 2099-01-01 | 121,358 | -0.35% | <0.001 | -0.23% | <0.001 | +0.28% | <0.001 |
↓ Bearish triggers negative alpha = signal was right (stock underperformed market)
| Bench | Metric | 1d | 5d | 20d | 60d | 252d |
|---|---|---|---|---|---|---|
| spx | Stock % | -0.19% | +0.24% | +1.57% | +3.35% | +12.65% |
| Bench % | +0.05% | +0.49% | +1.51% | +3.58% | +14.83% | |
| Alpha % | -0.24% | -0.28% | +0.11% | -0.19% | -2.12% | |
| Median alpha | -0.23% | -0.51% | -0.74% | -2.21% | -10.38% | |
| Hit rate (α>0) | 44.0% | 44.5% | 46.4% | 44.2% | 38.1% | |
| p (naive) | <0.001 | <0.001 | <0.001 | <0.001 | <0.001 | |
| p (HAC) | <0.001 | <0.001 | <0.001 | <0.001 | <0.001 | |
| N | 251,051 | 243,226 | 242,945 | 236,819 | 218,381 | |
| msci | Stock % | -0.19% | +0.24% | +1.57% | +3.35% | +12.65% |
| Bench % | +0.06% | +0.48% | +1.38% | +3.19% | +12.23% | |
| Alpha % | -0.26% | -0.26% | +0.27% | +0.23% | -0.25% | |
| Median alpha | -0.25% | -0.50% | -0.61% | -1.83% | -8.28% | |
| Hit rate (α>0) | 43.5% | 44.6% | 47.1% | 45.1% | 40.2% | |
| p (naive) | <0.001 | <0.001 | <0.001 | <0.001 | 0.0202 | |
| p (HAC) | <0.001 | <0.001 | <0.001 | <0.001 | 0.1602 | |
| N | 249,712 | 241,299 | 241,363 | 235,655 | 212,210 | |
| spxew | Stock % | -0.19% | +0.24% | +1.57% | +3.35% | +12.65% |
| Bench % | +0.06% | +0.51% | +1.49% | +3.13% | +11.08% | |
| Alpha % | -0.27% | -0.29% | +0.13% | +0.28% | +1.10% | |
| Median alpha | -0.24% | -0.51% | -0.71% | -1.75% | -6.71% | |
| Hit rate (α>0) | 44.2% | 44.5% | 46.6% | 45.3% | 41.7% | |
| p (naive) | <0.001 | <0.001 | <0.001 | <0.001 | <0.001 | |
| p (HAC) | <0.001 | <0.001 | <0.001 | <0.001 | <0.001 | |
| N | 249,080 | 238,447 | 239,501 | 233,198 | 210,763 |
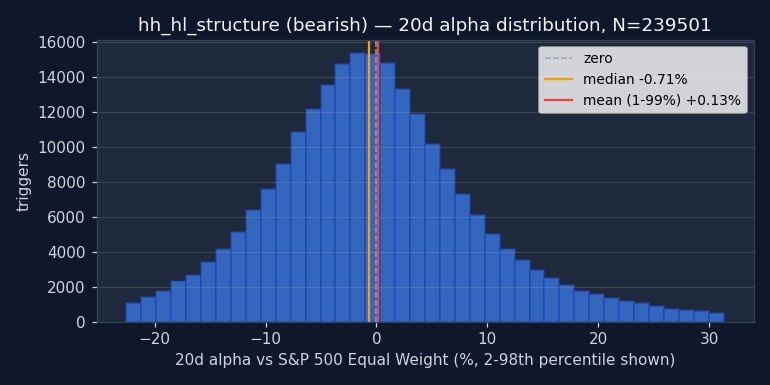
Permutation null detail — all horizons × both benchmarks
| Horizon | Bench | Observed lift | Null mean | Null 95% CI | pperm |
|---|---|---|---|---|---|
| 1d | spx | -0.13% | +0.09% | [+0.08%, +0.10%] | 0.005 |
| 1d | msci | -0.12% | +0.09% | [+0.08%, +0.10%] | 0.005 |
| 1d | spxew | -0.13% | +0.08% | [+0.07%, +0.09%] | 0.005 |
| 5d | spx | +0.16% | +0.37% | [+0.34%, +0.39%] | 0.005 |
| 5d | msci | +0.18% | +0.37% | [+0.35%, +0.40%] | 0.005 |
| 5d | spxew | +0.11% | +0.35% | [+0.33%, +0.38%] | 0.005 |
| 20d | spx | +1.51% | +1.18% | [+1.12%, +1.23%] | 1.000 |
| 20d | msci | +1.56% | +1.19% | [+1.14%, +1.25%] | 1.000 |
| 20d | spxew | +1.30% | +1.15% | [+1.09%, +1.21%] | 1.000 |
| 60d | spx | +3.07% | +2.58% | [+2.49%, +2.66%] | 1.000 |
| 60d | msci | +3.08% | +2.60% | [+2.52%, +2.69%] | 1.000 |
| 60d | spxew | +2.79% | +2.51% | [+2.43%, +2.60%] | 1.000 |
| 252d | spx | +6.17% | +5.37% | [+5.18%, +5.53%] | 1.000 |
| 252d | msci | +5.91% | +5.32% | [+5.16%, +5.48%] | 1.000 |
| 252d | spxew | +5.49% | +5.04% | [+4.87%, +5.20%] | 1.000 |
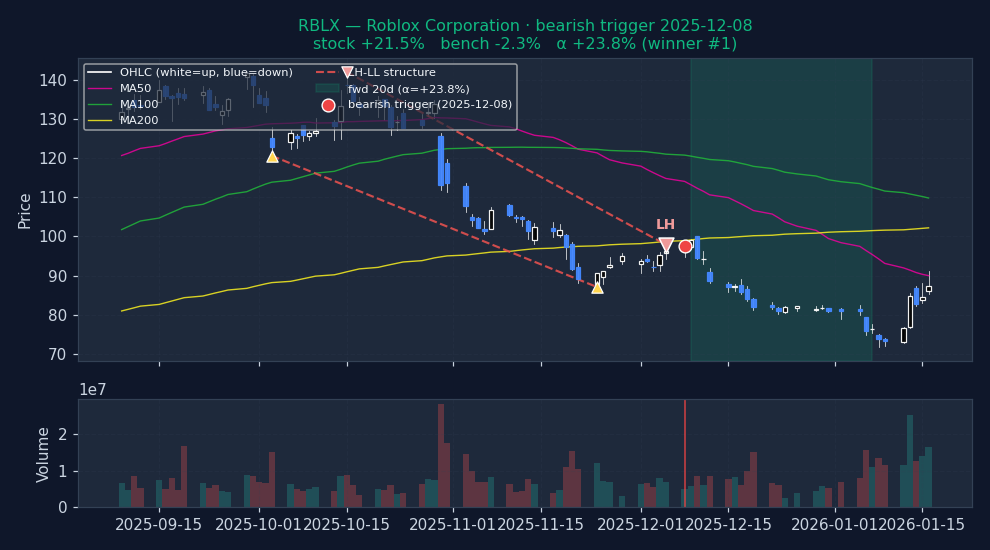
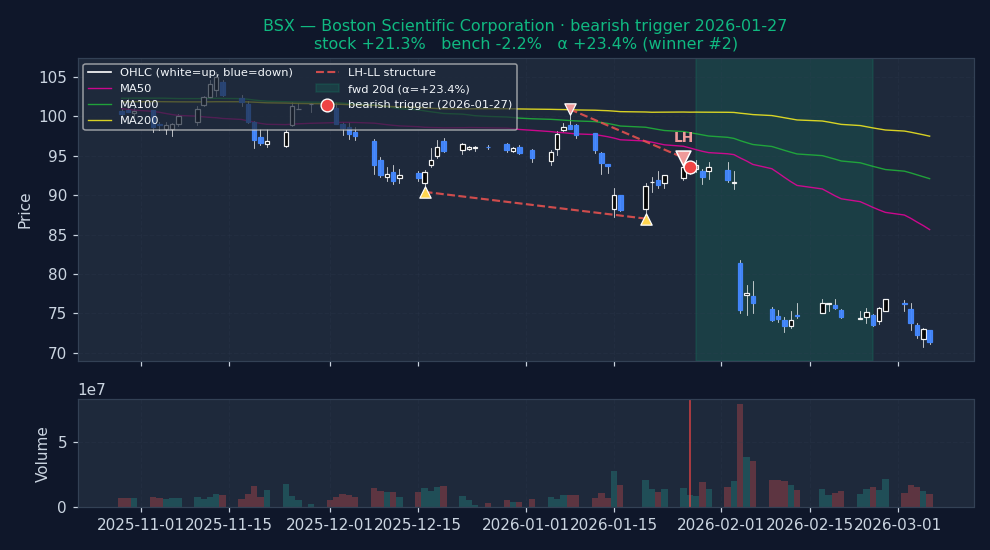
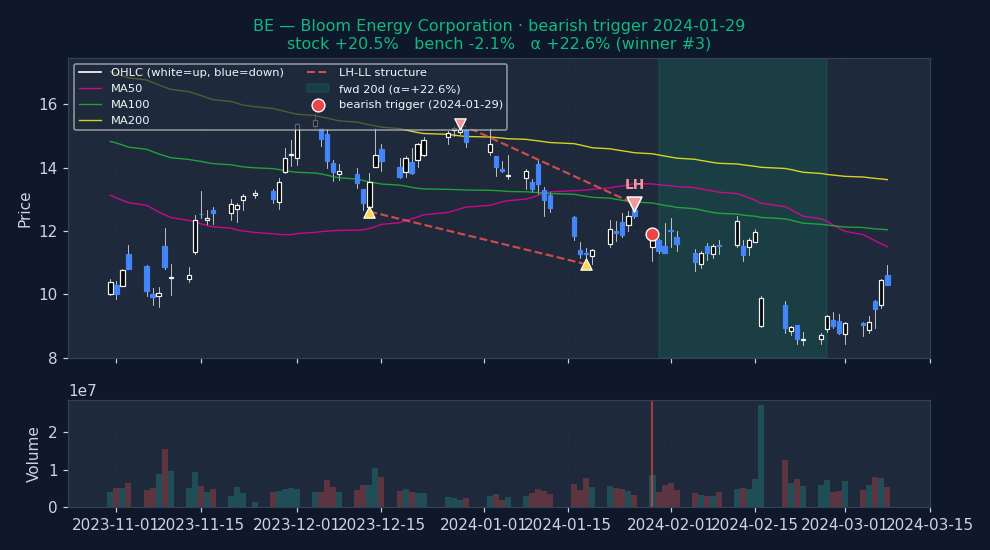
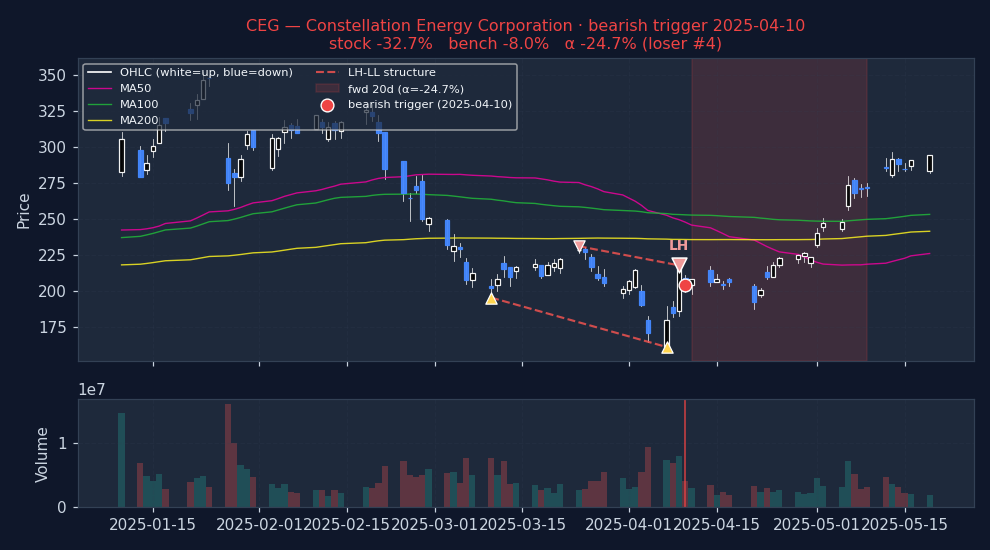
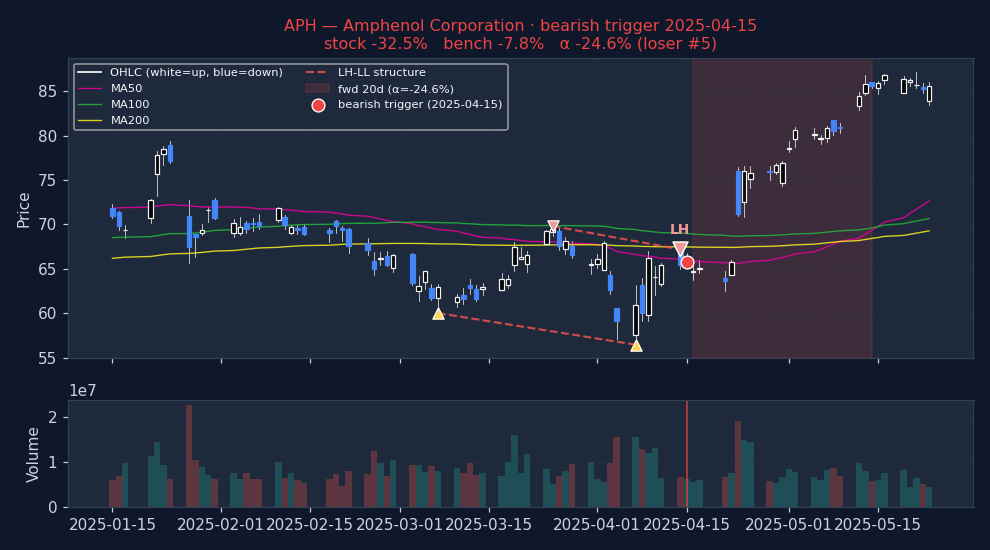
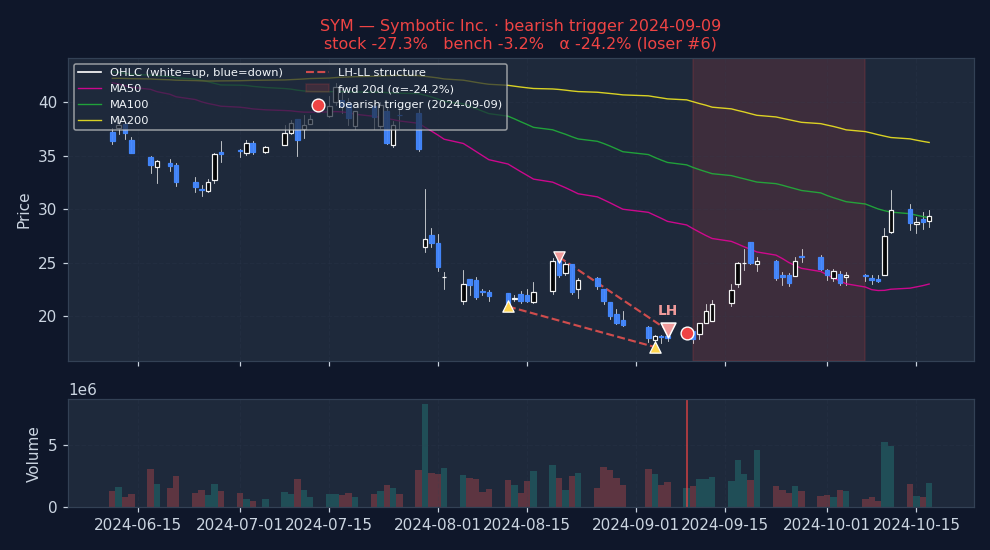
Example triggers on US large-caps (2023+, mcap ≥ $30B)
Six recent bearish HH_HL_STRUCTURE triggers on US mega-caps. Top three: the signal's best outcomes. Bottom three: the worst. Catalyst-driven outliers (|α| > 25%) excluded so what's left is the signal's own typical good and bad days, not earnings shocks.
Strongest outcomes (what HH_HL_STRUCTURE looks like when it works)
Weakest outcomes (what HH_HL_STRUCTURE looks like when it fails)
Stock-regime quadrants (2×2 per-stock, 20d alpha detail table)
| Quadrant | N | Stock % (spx) | Bench % (spx) | Alpha % (spx) | p (HAC) | Stock % (msci) | Bench % (msci) | Alpha % (msci) | p (HAC) | Stock % (spxew) | Bench % (spxew) | Alpha % (spxew) | p (HAC) |
|---|---|---|---|---|---|---|---|---|---|---|---|---|---|
| Trending + Low vol Clean directional grind, low whipsaw | 10,565 | +0.56% | +0.96% | -0.36% | <0.001 | +0.56% | +0.89% | -0.26% | <0.001 | +0.56% | +0.81% | -0.19% | 0.0029 |
| Trending + High vol Crisis selloff or parabolic rally | 119,839 | +1.98% | +1.82% | +0.18% | <0.001 | +1.98% | +1.65% | +0.41% | <0.001 | +1.98% | +1.86% | +0.15% | <0.001 |
| Non-trending + Low vol Quiet chop, summer doldrums | 11,874 | +0.52% | +0.82% | -0.27% | <0.001 | +0.52% | +0.74% | -0.18% | 0.0024 | +0.52% | +0.62% | -0.05% | 0.3658 |
| Non-trending + High vol Classical "whipsaw zone" for momentum | 116,822 | +1.36% | +1.31% | +0.13% | 0.0003 | +1.36% | +1.24% | +0.24% | <0.001 | +1.36% | +1.28% | +0.16% | <0.001 |
Sub-period breakdown table (20d alpha)
| Period | N | Alpha % (spx) | p (HAC) | Alpha % (msci) | p (HAC) | Alpha % (spxew) | p (HAC) |
|---|---|---|---|---|---|---|---|
| 2015-2019 2015-01-01 → 2020-01-01 | 75,856 | +0.02% | 0.4932 | +0.20% | <0.001 | +0.04% | 0.2364 |
| 2020-2022 2020-01-01 → 2023-01-01 | 81,332 | +0.70% | <0.001 | +1.06% | <0.001 | +0.31% | <0.001 |
| 2023-2026 2023-01-01 → 2099-01-01 | 101,873 | -0.30% | <0.001 | -0.31% | <0.001 | +0.05% | 0.2109 |
Methodology and caveats
How to read. Entry at open of T+1 (one trading day after the signal fires on close of T). 20d = open T+1 to close T+20. Alpha = stock return − benchmark return over the same window (Convention A, single-sided, textbook). For bullish triggers, POSITIVE alpha = signal was right. For bearish triggers, NEGATIVE alpha = signal was right (stock underperformed market). No sign-flipping; the direction of the bet determines what "good" looks like. Per-stock regime is each stock's own ADX(14) and RV(20) at the trigger date — not market-wide state.
Three p-values, three robustness tests. (a) p_naive: scipy one-sample t-test on winsorized alphas. Optimistic because overlapping 20d windows on the same ticker inflate effective N. (b) p_hac: Newey-West HAC with lag = horizon — corrects for the overlap and is the academic-finance standard. (c) p_perm: fraction of 200 random-date null iterations with mean ≥ observed. Tests whether the signal beats random date selection at all. A signal that clears all three (pnaive, phac, pperm all < 0.05) has real information; a signal that fails pperm has zero edge even if the t-test says "significant."
Caveats. (i) Universe reflects today's active tickers; delisted losers pruned → survivorship bias. (ii) Mcap ≥ $100M filter uses today's snapshot, not point-in-time — mild lookahead on which stocks enter the sample, not on returns. (iii) Means and p-values use winsorized alphas (1/99 percentile) to prevent data errors from dominating. Medians and hit rates use raw data. (iv) Zero transaction costs assumed. Realistic bid-ask + commissions remove 20–40bps from 20d alpha on US large-caps, more on small-cap. Sub-20bps alpha is noise in practice. (v) Past performance does not predict future results.
How to use this
1 · When to reach for this signal
Caution recommended. Bullish 20d alpha is -0.59% and worse than random — triggering on random dates would have produced better long-side returns. Bearish 20d alpha is +0.11% and worse than random . Either direction fails the "beats random" test. Don't use HH/HL Trend Structure as a standalone entry trigger. It may still be useful as part of a composite (section 4).
2 · When it works — the setups that drive it
- Best bullish setup: Trending + High vol — alpha -0.48% / 20d on 168,349 historical triggers.
- Best bearish setup: Trending + High vol — alpha +0.18% / 20d on 119,839 historical triggers.
- Best era for bullish: 2023-2026 — alpha -0.35% / 20d.
- Best era for bearish: 2020-2022 — alpha +0.70% / 20d.
3 · When it fails — common false positives
- Weakest bullish cell: Non-trending + High vol — alpha -0.76% / 20d on 90,677 triggers.
- Weakest bearish cell: Trending + Low vol — alpha -0.36% / 20d on 10,565 triggers.
- Worst era for bullish: 2015-2019 — alpha -0.95% / 20d.
- Worst era for bearish: 2023-2026 — alpha -0.30% / 20d.
Signal-specific failure patterns
4 · Pairing inside a screen
The statements below describe how this signal relates to others by construction — which indicator family it belongs to, and where same-family redundancy might reduce the independence of evidence inside a Daily Report. These are taxonomic classifications drawn from standard technical-analysis texts; they are not pairing backtests. A multi-signal convergence backtest is planned but not yet run.
Trend-structure family
Higher-high / higher-low structure encodes the classical Dow-theory definition of an uptrend — a price structure of successively higher swing highs and swing lows (Dow theory as presented in Murphy, Technical Analysis of the Financial Markets, 1999; Edwards & Magee, Technical Analysis of Stock Trends, 11th ed. 2018). This overlaps with HH/HL streak, moving-average crossover, and long-term trend-break signals, which infer the same trend state from different measurements.
What would likely rescue this signal
This block calls out the data or conditions that could turn a technically weak signal into a usable one in a composite screen. Based on signal mechanics and the observed failure patterns above; individual combinations are not yet backtested.
- Use as a regime classifier, not a trigger — HH/HL structure is better thought of as what kind of trend a stock is in rather than whether to buy or short now. Apply as a filter to other signals.
- Early-trend bullish refinement — The signal underperforms at short horizons but works long-term. Subset to triggers within the first 3 months of trend formation (trendiness-days counter) to capture earlier entries.
See also Why technical-only signals don't survive on their own for the broader argument.
5 · Before you act — a 5-point checklist
- Normal trading day? Rule out earnings (within ±3 days), ex-dividend, or known corporate-action dates — the signal is almost certainly reading noise, not momentum, in those windows.
- Where is price vs its own 50 / 200 DMA? Pattern signals carry their own structural context; check that the implied support/resistance levels have historical relevance, not just the most-recent 3-month range.
- What's the sector breadth doing? An isolated signal in a broadly down-trending sector is a lower-confidence setup than one firing with the rest of its peer group.
- Is ADV20 enough for your size? If the trigger is on a $500M name and you want to move $1M notional, you're the tape. Consider adv20d ≥ 5% of your intended position.
- What invalidates you? Define a price level (for longs: a close below the trigger-day low; for shorts: close above the trigger-day high) and honor it. The backtest alpha is an average; any one trade can be at either tail.
Execution notes
Best use: regime classifier rather than entry trigger. Apply as a filter to other signals (e.g., take bullish RSI only when HH/HL structure is also bullish). For long-term position takers, the 1-year bullish edge is real and tradable; for swing horizons, treat the signal as confirmation of trend, not as a timing tool.