weekly
·
14 min read
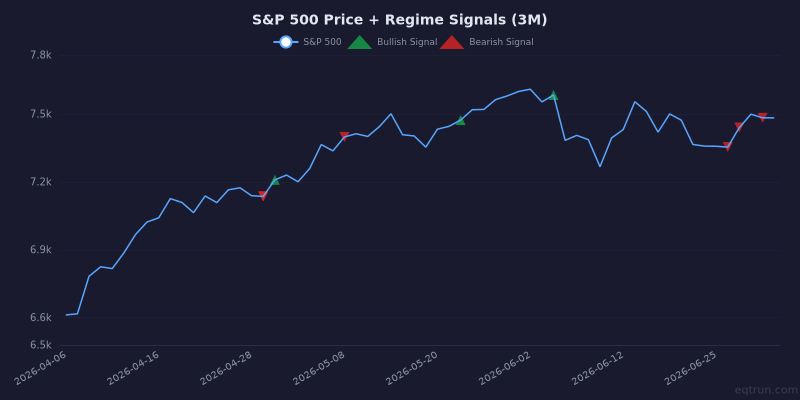
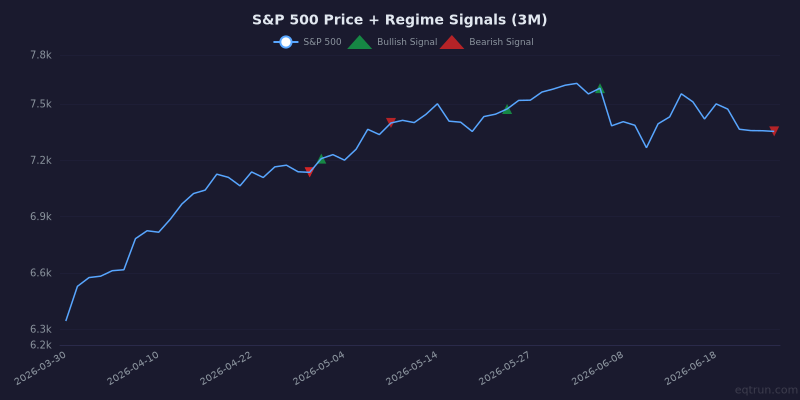
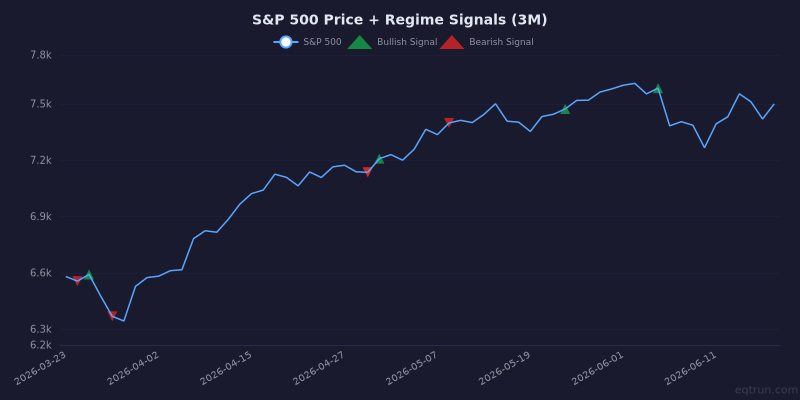
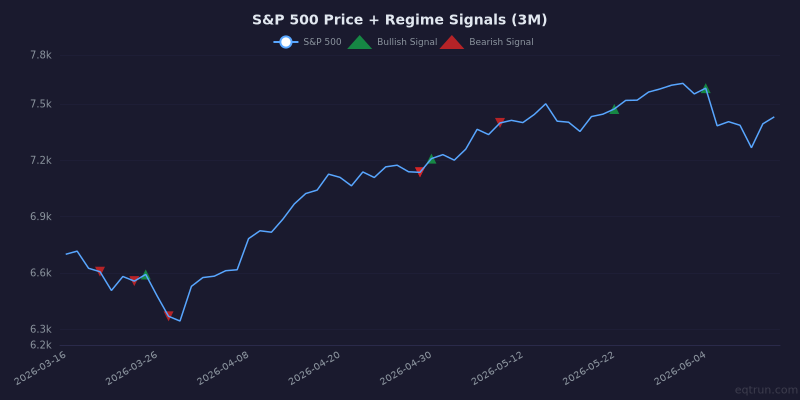
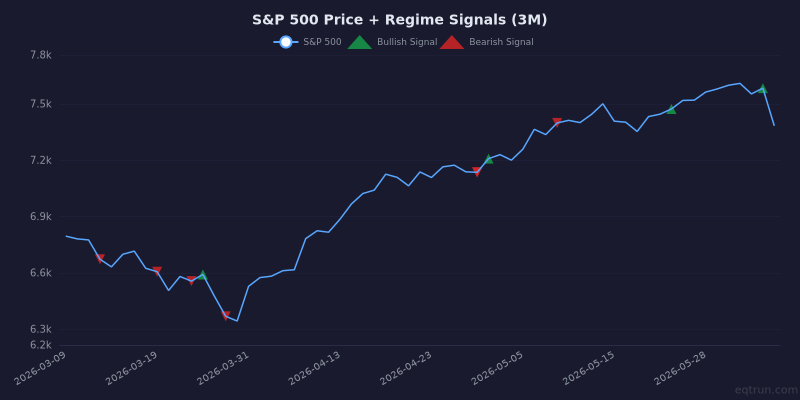
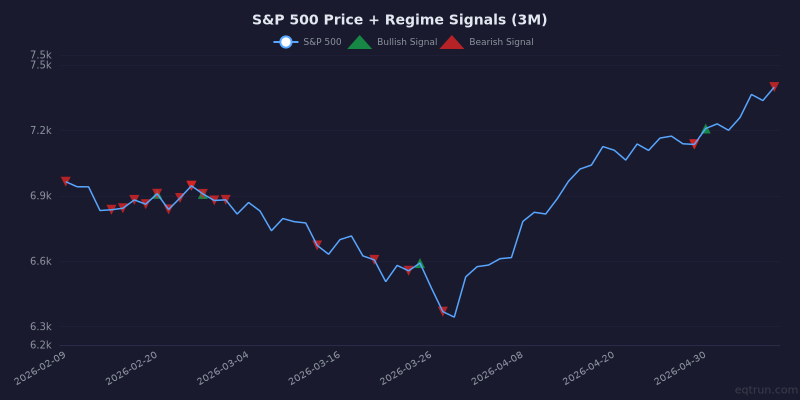
Weekly Market Breadth Report — July 03, 2026
Weekly breadth report with z-score analysis across 14 indexes, 11 sectors, and 13 ETFs.
Read more →