Weekly Market Breadth Report — June 19, 2026
This report is AI-generated from Chartlas's market data and breadth analytics. It is not human-written market commentary and does not constitute investment advice.
Market Overview
S&P 500 was roughly flat this week (+0.9%) to 7,501. MSCI World (ACWI) gained +0.8% to 158. Momentum (3/6) and trend (3/6) are both in the mid-range — near-baseline forward returns historically. Best performer: Nikkei 225 (+7.9%). Weakest: Hang Seng (-3.2%).
| Metric | This Week | Last Week | 1Y Avg | Z (1Y) |
|---|---|---|---|---|
| Bullish Signal % | 55.1% | 46.2% | 54.4% | +0.2 |
| Bullish Signals | 113,732 | 120,459 | ||
| Bearish Signals | 92,842 | 139,995 |
Signal balance is near its 1-year norm — nothing unusual this week.
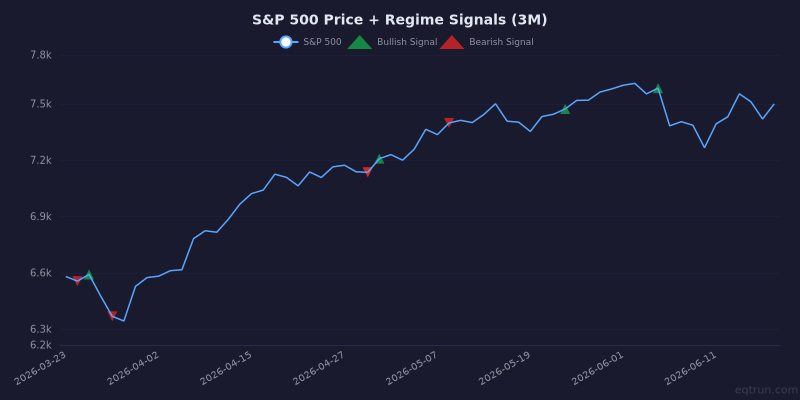
S&P 500 price with regime signal markers. Green triangles = bullish signals, red triangles = bearish signals.
Key Takeaways
- 🟡 S&P 500: Flat this week at 7,501 (+0.9%).
- 🟡 Breadth: Momentum (3/6) and trend (3/6) are both in the mid-range. Near-baseline forward returns — no strong directional signal from breadth.
- 🔴 Breadth — 200 DMA Breadth: At an extreme reading (z=-1.8). Uncommon weakness — could mark a washout or further downside.
- 🟡 Nikkei 225: A McClellan Zero Cross signal fired this week (bearish).
Stocks with the Most Signals
Large-cap stocks ($10B+) with 5+ signals fired this week.
| Symbol | Name | Sector | Signals | Net | 1W % |
|---|---|---|---|---|---|
| FOX | Fox Corporation | Communication Services | 31 | -29 | -20% |
| 302132.SZ | AVIC Chengdu Aircraft Company | Technology | 31 | -31 | +0% |
| EBS.VI | Erste Group Bank AG | Financial Services | 29 | +27 | +7% |
| SAN.MC | Banco Santander, S.A. | Financial Services | 29 | +23 | +7% |
| ABN.AS | ABN AMRO Bank N.V. | Financial Services | 28 | +26 | +9% |
| FOXA | Fox Corporation | Communication Services | 28 | -26 | -21% |
| 6361.T | Ebara Corporation | Industrials | 27 | +23 | +19% |
| TPRO.MI | Technoprobe S.p.A. | Technology | 27 | +23 | +13% |
Momentum Breadth
Short-term oscillators and price velocity indicators.
| Index | This Week | Last Week | Change | Z (1Y) | Trend |
|---|---|---|---|---|---|
| Advance / Decline | -8,220 | +6,593 | -14,813 | -0.6 | Flipped bearish |
| New 20D High/Low | -864 | -12,531 | +11,667 | -0.3 | Improving |
| MACD Breadth | +4,036 | +208 | +3,828 | +1.6 | Strengthening |
| RSI Extremes | +160 | +2,618 | -2,458 | +0.8 | Deteriorating |
| Bollinger Band | -1,968 | +2,976 | -4,944 | -0.3 | Flipped bearish |
| Weekly Movers (±10%) | +9,034 | -8,747 | +17,781 | +1.5 | Flipped bullish |
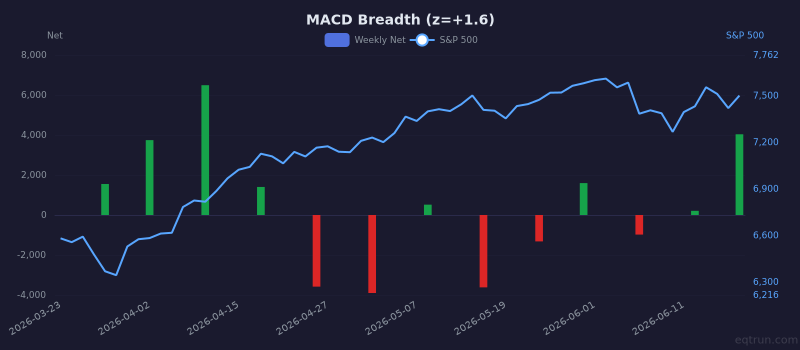
MACD Breadth weekly net (bars) with S&P 500 price (right axis). 1Y z-score: +1.6.
Trend Breadth
Longer-term structural indicators.
| Index | This Week | Last Week | Change | Z (1Y) | Trend |
|---|---|---|---|---|---|
| 52-Week High/Low | -123 | -5,136 | +5,013 | -1.1 | Improving |
| Fresh 52W High/Low | +127 | -522 | +649 | -0.8 | Flipped bullish |
| 200 DMA Breadth | -10,405 | -18,724 | +8,319 | -1.8 | Improving |
| MA Cross (Golden/Death) | +52 | -27 | +79 | +0.0 | Flipped bullish |
| HH/HL Structure | -86 | +312 | -398 | -0.9 | Flipped bearish |
| Breakout / Breakdown | +361 | +317 | +44 | -0.8 | Strengthening |
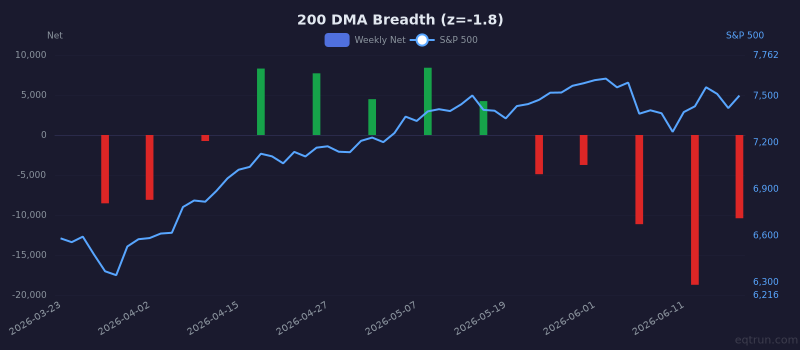
200 DMA Breadth weekly net (bars) with S&P 500 price (right axis). 1Y z-score: -1.8.
Pattern Breadth
| Index | This Week | Last Week | Change | Z (1Y) | Trend |
|---|---|---|---|---|---|
| Double Top/Bottom | -94 | -642 | +548 | -0.5 | Improving |
| Failed Pattern | +271 | +98 | +173 | +1.6 | Strengthening |
Major ETF Signals
| Ticker | Name | Momentum | Trend | Pattern | Net | Z (1Y) |
|---|---|---|---|---|---|---|
| DIA | Dow Jones | 3↑ 4↓ | 7↑ | — | +6 | +1.1 |
| EWJ | Japan | 3↑ 1↓ | 9↑ | — | +11 | +2.2 |
| EEM | Emerging Markets | 3↑ 1↓ | 5↑ | — | +7 | +0.7 |
| IWM | Russell 2000 | 2↑ 4↓ | 3↑ | — | +1 | -0.2 |
| USO | Oil (USO) | 2↑ 6↓ | 1↓ | — | -5 | -1.2 |
| TLT | 20+ Year Treasury | 4↑ 2↓ | 1↑ | — | +3 | +0.8 |
| SPY | S&P 500 | 1↓ | 2↑ 1↓ | — | +0 | -0.8 |
| QQQ | NASDAQ 100 | 2↓ | 1↑ | — | -1 | -0.8 |
| EFA | EAFE (Dev ex-US) | 1↓ | 1↑ 1↓ | — | -1 | -0.6 |
| HYG | High Yield Corp | — | 2↑ 1↓ | — | +1 | -0.0 |
| IBIT | Bitcoin | 1↑ | — | — | +1 | +0.2 |
| GLD | Gold | 1↑ | — | — | +1 | -0.2 |
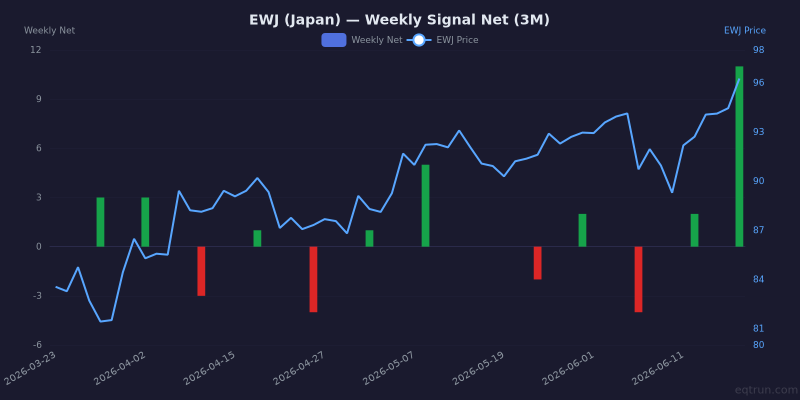
EWJ weekly net signals (bars) with EWJ price (blue line, right axis). 1Y z-score: +2.2.
Sector Breadth (Advance/Decline)
| Sector | Net | % Bullish | Z (1Y) |
|---|---|---|---|
| Technology | -7 | 50.0% | +0.2 |
| Financial Services | -328 | 48.0% | -0.4 |
| Utilities | -395 | 40.4% | -1.6 |
| Energy | -557 | 37.2% | -1.7 |
| Communication Services | -559 | 40.4% | -1.2 |
| Industrials | -621 | 48.1% | -0.1 |
| Real Estate | -638 | 42.7% | -1.1 |
| Healthcare | -745 | 45.1% | -0.4 |
| Consumer Defensive | -1,004 | 39.7% | -1.5 |
| Basic Materials | -1,361 | 41.9% | -1.0 |
| Consumer Cyclical | -1,504 | 42.5% | -0.9 |
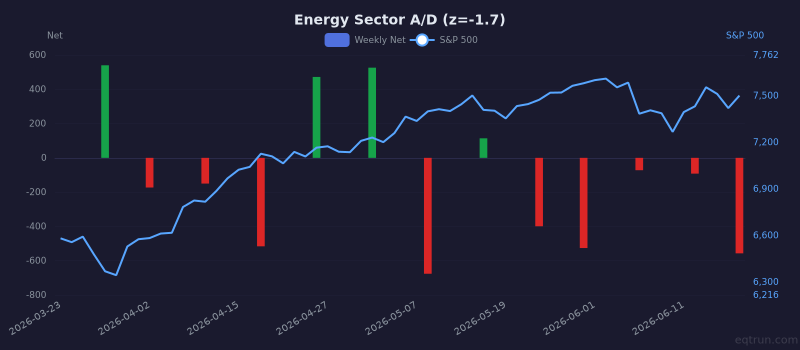
Energy sector weekly A/D net with S&P 500 price (right axis). 1Y z-score: -1.7.
What to Watch Next Week
- 200 DMA Breadth at -10,405. Improving but still negative.
- Weekly Movers (±10%) leading at +9,034. Watch for continuation vs exhaustion.
- Advance / Decline just flipped — need follow-through to confirm.
Last Week We Said
From our report on June 12:
- 🟡 S&P 500: Flat this week at 7,431 (+0.6%).
- 🟢 MSCI World (ACWI): Gained +1.3%, tracking US markets. The rally is global.
- 🟡 Breadth: Momentum improving while trend deteriorating — a divergence. Short-term bounce within structural weakness. Above-average forward returns historically, but direction is uncertain.
What happened: S&P 500 was flat (+0.9%). The mixed signals were warranted — no clear direction.
Get this report in your inbox every Saturday
Free for all Chartlas users. Plus daily signal alerts, custom screens, PDF exports, and live breadth/regime dashboards.
Create free account →