Weekly Market Breadth Report — July 24, 2026
Corrected 18 August 2026. This post was produced by an earlier breadth/regime engine later found to contain calculation errors. In this post: advance/decline figures were computed from a contaminated series and have been recomputed from the corrected data; one regime-signal takeaway was reworded — the signal did fire, but its forward-return framing did not survive revalidation; forward-return claims that rested on a backtest of the same faulty series have been dropped; 2 charts plotted from the old engine have been removed; the 'what happened' scorecard on the previous week's takeaways has been dropped. Price data, signal counts, ETF tables and index moves are unaffected.
This report is AI-generated from Chartlas's market data and breadth analytics. It is not human-written market commentary and does not constitute investment advice.
Market Overview
S&P 500 was roughly flat this week (-0.6%) to 7,412. MSCI World (ACWI) lost -0.5% to 154. Momentum is weak (2/6) while trend is in the mid-range (2/6). Short-term selling pressure within a mixed structural backdrop. Best performer: Hang Seng (+1.6%). Weakest: NASDAQ Composite (-2.1%).
| Metric | This Week | Last Week | 1Y Avg | Z (1Y) |
|---|---|---|---|---|
| Bullish Signal % | 47.2% | 44.0% | 53.6% | -0.8 |
| Bullish Signals | 88,966 | 85,639 | ||
| Bearish Signals | 99,696 | 109,198 |
Slightly more bearish than the 1-year weekly average (z=-0.8).
Key Takeaways
- 🟡 S&P 500: Flat this week at 7,412 (-0.6%).
- 🟡 Breadth: Momentum is weak (2/6) while trend is in the mid-range (2/6). Short-term selling pressure within a mixed structural backdrop. Second consecutive week of weak momentum.
- 🔴 Breadth — 200 DMA Breadth: At an extreme reading (z=-2.2). Uncommon weakness — could mark a washout or further downside.
- 🟡 S&P 500: A Hindenburg Omen fired — both new 52-week highs and lows elevated while breadth momentum is negative. A split, unhealthy tape. At index scope this signal showed no forward edge in our backtest — context, not a crash call.
Stocks with the Most Signals
Large-cap stocks ($10B+) with 5+ signals fired this week.
| Symbol | Name | Sector | Signals | Net | 1W % |
|---|---|---|---|---|---|
| 6505.TW | Formosa Petrochemical Corporat | Energy | 24 | +2 | +6% |
| SGRO.L | SEGRO Plc | Real Estate | 19 | +7 | +9% |
| 600236.SS | Guangxi Guiguan Electric Power | Utilities | 17 | -1 | +1% |
| 3665.TW | BizLink Holding Inc. | Industrials | 16 | +12 | +25% |
| MAP.MC | Mapfre, S.A. | Financial Services | 15 | -3 | -3% |
| SNG.RO | SNGN Romgaz SA | Energy | 15 | +11 | +19% |
| BN.TO | Brookfield Corporation | Financial Services | 15 | -7 | -4% |
| CHRW | C.H. Robinson Worldwide, Inc. | Industrials | 15 | -7 | -10% |
Momentum Breadth
Short-term oscillators and price velocity indicators.
| Index | This Week | Last Week | Change | Z (1Y) | Trend |
|---|---|---|---|---|---|
| Advance / Decline | -8,966 | -12,370 | +3,404 | -0.6 | Improving |
| New 20D High/Low | -5,933 | -5,979 | +46 | -0.9 | Stable |
| MACD Breadth | -1,324 | -1,281 | -43 | -0.6 | Stable |
| RSI Extremes | +1,088 | -317 | +1,405 | +1.3 | Flipped bullish |
| Bollinger Band | +1,688 | -1,287 | +2,975 | +1.1 | Flipped bullish |
| Weekly Movers (±10%) | -7,366 | -6,399 | -967 | -2.1 | Weakening |
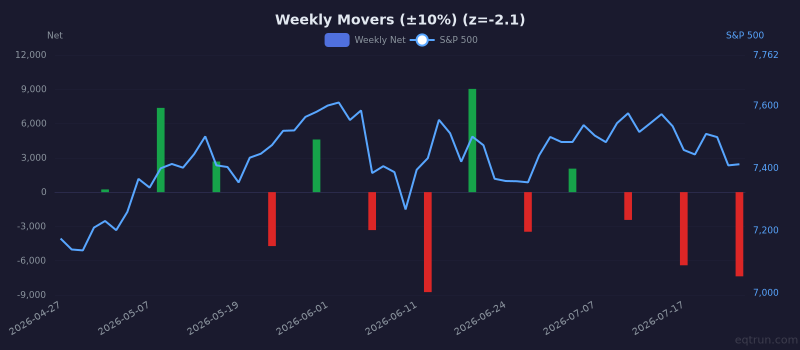
Weekly Movers (±10%) weekly net (bars) with S&P 500 price (right axis). 1Y z-score: -2.1.
Trend Breadth
Longer-term structural indicators.
| Index | This Week | Last Week | Change | Z (1Y) | Trend |
|---|---|---|---|---|---|
| 52-Week High/Low | -3,973 | -1,694 | -2,279 | -2.1 | Weakening |
| Fresh 52W High/Low | +0 | -338 | +338 | -0.9 | Improving |
| 200 DMA Breadth | -24,678 | -18,555 | -6,123 | -2.2 | Weakening |
| MA Cross (Golden/Death) | -249 | -219 | -30 | -0.9 | Weakening |
| HH/HL Structure | +128 | -203 | +331 | -0.3 | Flipped bullish |
| Breakout / Breakdown | +262 | +514 | -252 | -0.8 | Deteriorating |
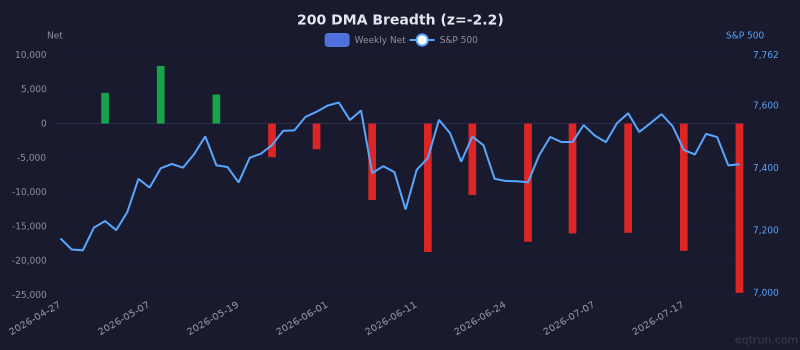
200 DMA Breadth weekly net (bars) with S&P 500 price (right axis). 1Y z-score: -2.2.
Pattern Breadth
| Index | This Week | Last Week | Change | Z (1Y) | Trend |
|---|---|---|---|---|---|
| Double Top/Bottom | -398 | -400 | +2 | -1.2 | Stable |
| Failed Pattern | +108 | -15 | +123 | +0.7 | Flipped bullish |
Major ETF Signals
| Ticker | Name | Momentum | Trend | Pattern | Net | Z (1Y) |
|---|---|---|---|---|---|---|
| USO | Oil (USO) | 5↑ 4↓ | 1↑ | — | +2 | +0.2 |
| IBIT | Bitcoin | 2↑ 3↓ | 1↓ | — | -2 | -0.3 |
| QQQ | NASDAQ 100 | 4↑ 1↓ | — | — | +3 | +0.0 |
| TLT | 20+ Year Treasury | 2↑ 2↓ | 1↓ | — | -1 | -0.4 |
| EFA | EAFE (Dev ex-US) | 2↑ | 1↑ 1↓ | — | +2 | +0.1 |
| GLD | Gold | 1↑ 1↓ | 1↑ 1↓ | — | +0 | -0.5 |
| DIA | Dow Jones | 3↑ | 1↑ | — | +4 | +0.6 |
| SPY | S&P 500 | 1↑ | 2↑ 1↓ | — | +2 | -0.2 |
| EEM | Emerging Markets | 2↑ | 1↓ | — | +1 | -0.3 |
| EWJ | Japan | 3↑ | — | — | +3 | +0.4 |
| IWM | Russell 2000 | 3↑ | — | — | +3 | +0.1 |
| HYG | High Yield Corp | 1↓ | 2↓ | — | -3 | -1.0 |
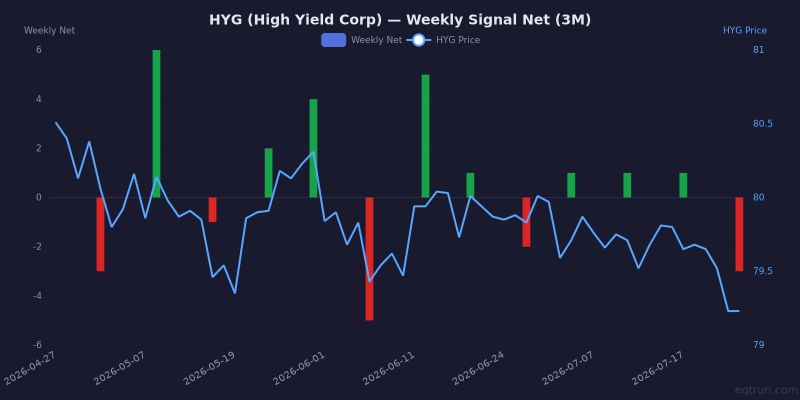
HYG weekly net signals (bars) with HYG price (blue line, right axis). 1Y z-score: -1.0.
Sector Breadth (Advance/Decline)
| Sector | Net | % Bullish | Z (1Y) |
|---|---|---|---|
| Energy | +585 | 59.4% | +1.4 |
| Utilities | +135 | 52.4% | +0.4 |
| Basic Materials | -236 | 49.0% | -0.1 |
| Financial Services | -274 | 48.8% | -0.4 |
| Communication Services | -519 | 43.6% | -0.9 |
| Real Estate | -591 | 45.0% | -0.8 |
| Consumer Defensive | -827 | 43.9% | -1.0 |
| Industrials | -1,026 | 47.8% | -0.3 |
| Technology | -1,716 | 44.9% | -0.6 |
| Consumer Cyclical | -1,867 | 43.3% | -0.9 |
| Healthcare | -2,070 | 40.7% | -1.3 |
What to Watch Next Week
- 200 DMA Breadth at -24,678. Continuing to weaken.
- Bollinger Band leading at +1,688. Watch for continuation vs exhaustion.
- RSI Extremes just flipped — need follow-through to confirm.
Last Week We Said
From our report on July 17:
- 🔴 S&P 500: Fell -1.6% to 7,458. Both momentum and trend breadth are weak — broad weakness across timeframes.
- 🔴 MSCI World (ACWI): Lost -1.7% — selling pressure is global.
- 🔴 Breadth: Both momentum (0/6) and trend (1/6) are weak. Broad weakness across timeframes.
Get this report in your inbox every Saturday
Free for all Chartlas users. Plus daily signal alerts, custom screens, PDF exports, and live breadth/regime dashboards.
Create free account →