Weekly Market Breadth Report — June 05, 2026
This report is AI-generated from Chartlas's market data and breadth analytics. It is not human-written market commentary and does not constitute investment advice.
Market Overview
S&P 500 fell this week (-2.6%) to 7,384. MSCI World (ACWI) lost -2.6% to 154. Momentum is weak (2/6) while trend is in the mid-range (3/6). Short-term selling pressure within a mixed structural backdrop — below-average forward returns historically. Best performer: CAC 40 (+0.4%). Weakest: NASDAQ Composite (-4.7%).
| Metric | This Week | Last Week | 1Y Avg | Z (1Y) |
|---|---|---|---|---|
| Bullish Signal % | 42.5% | 49.2% | 54.8% | -2.0 |
| Bullish Signals | 107,265 | 113,911 | ||
| Bearish Signals | 144,849 | 117,552 |
Net bullish balance of -37,584 puts this week in the bottom ~5% of all weeks over the past year (z=-2.0).
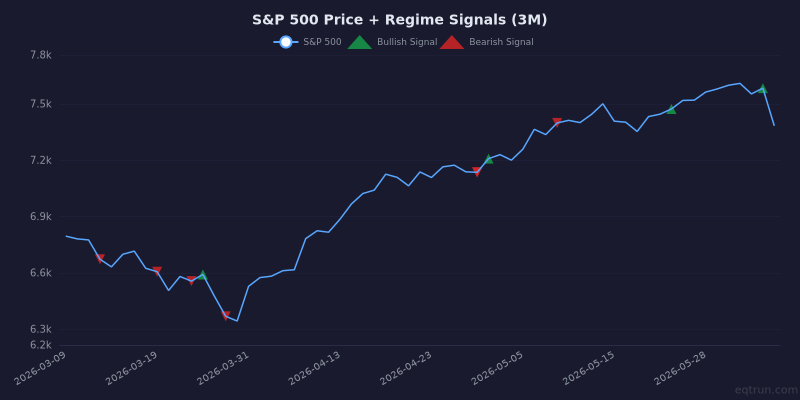
S&P 500 price with regime signal markers. Green triangles = bullish signals, red triangles = bearish signals.
Key Takeaways
- 🔴 S&P 500: Fell -2.6% to 7,384. Breadth confirms the weakness.
- 🔴 MSCI World (ACWI): Lost -2.6% — selling pressure is global.
- 🟡 Breadth: Momentum is weak (2/6) while trend is in the mid-range (3/6). Short-term selling pressure within a mixed structural backdrop — below-average forward returns. Second consecutive week of weak momentum.
- 🔴 Breadth — 52-Week High/Low: At an extreme reading (z=-2.6). Uncommon weakness — could mark a washout or further downside.
- 🟢 S&P 500: McClellan Oscillator crossed above zero — breadth momentum shifted from negative to positive.
Stocks with the Most Signals
Large-cap stocks ($10B+) with 5+ signals fired this week.
| Symbol | Name | Sector | Signals | Net | 1W % |
|---|---|---|---|---|---|
| 302132.SZ | AVIC Chengdu Aircraft Company | Technology | 47 | -47 | +0% |
| 600487.SS | Hengtong Optic-Electric Co., L | Technology | 30 | +26 | +25% |
| 600188.SS | Yankuang Energy Group Company | Energy | 28 | +18 | +15% |
| 2382.TW | Quanta Computer Inc. | Technology | 27 | +19 | +15% |
| 3231.TW | Wistron Corporation | Technology | 27 | +17 | +8% |
| 2883.TW | KGI Financial Holding Co., Ltd | Financial Services | 26 | +24 | +23% |
| 002484.SZ | Nantong Jianghai Capacitor Co. | Industrials | 26 | +18 | +16% |
| 000636.SZ | Guangdong Fenghua Advanced Tec | Technology | 26 | +20 | +12% |
Momentum Breadth
Short-term oscillators and price velocity indicators.
| Index | This Week | Last Week | Change | Z (1Y) | Trend |
|---|---|---|---|---|---|
| Advance / Decline | -14,327 | -11,602 | -2,725 | -1.2 | Weakening |
| New 20D High/Low | -12,055 | -7,352 | -4,703 | -1.9 | Weakening |
| MACD Breadth | -979 | +1,595 | -2,574 | -0.3 | Flipped bearish |
| RSI Extremes | +483 | -92 | +575 | +1.2 | Flipped bullish |
| Bollinger Band | +877 | -385 | +1,262 | +0.9 | Flipped bullish |
| Weekly Movers (±10%) | -3,320 | +4,608 | -7,928 | -1.7 | Flipped bearish |
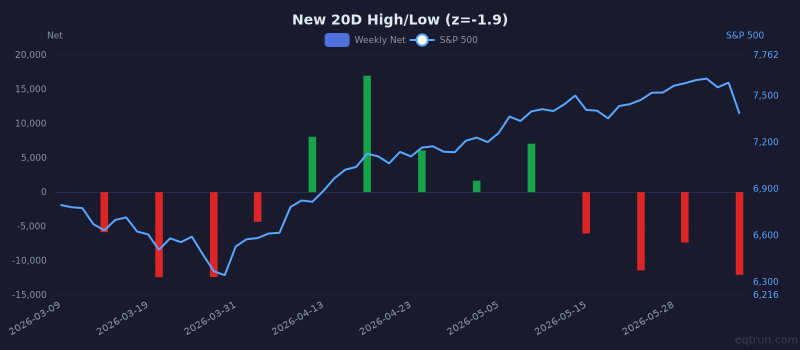
New 20D High/Low weekly net (bars) with S&P 500 price (right axis). 1Y z-score: -1.9.
Trend Breadth
Longer-term structural indicators.
| Index | This Week | Last Week | Change | Z (1Y) | Trend |
|---|---|---|---|---|---|
| 52-Week High/Low | -3,020 | -954 | -2,066 | -2.6 | Weakening |
| Fresh 52W High/Low | -463 | -86 | -377 | -2.3 | Weakening |
| 200 DMA Breadth | -11,145 | -3,745 | -7,400 | -2.0 | Weakening |
| MA Cross (Golden/Death) | +26 | -128 | +154 | -0.0 | Flipped bullish |
| HH/HL Structure | +18 | +174 | -156 | -0.7 | Deteriorating |
| Breakout / Breakdown | +270 | +407 | -137 | -1.0 | Deteriorating |
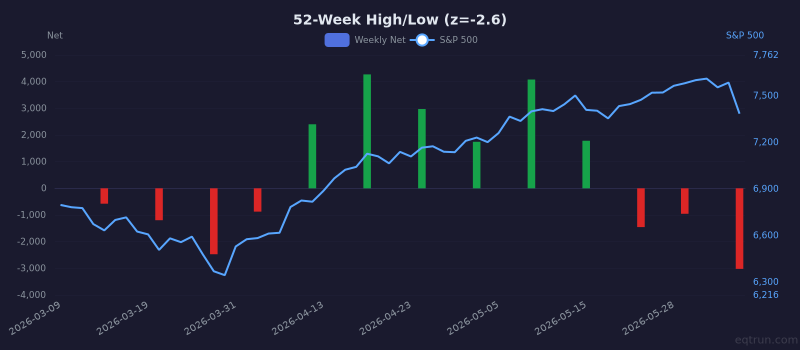
52-Week High/Low weekly net (bars) with S&P 500 price (right axis). 1Y z-score: -2.6.
Pattern Breadth
| Index | This Week | Last Week | Change | Z (1Y) | Trend |
|---|---|---|---|---|---|
| Double Top/Bottom | -549 | -427 | -122 | -2.0 | Weakening |
| Failed Pattern | -35 | +27 | -62 | +0.0 | Flipped bearish |
Major ETF Signals
| Ticker | Name | Momentum | Trend | Pattern | Net | Z (1Y) |
|---|---|---|---|---|---|---|
| DIA | Dow Jones | 6↑ 9↓ | 9↑ | — | +6 | +1.2 |
| IBIT | Bitcoin | 13↓ | 5↓ | — | -18 | -3.2 |
| QQQ | NASDAQ 100 | 4↑ 6↓ | 6↑ 1↓ | — | +3 | -0.1 |
| EEM | Emerging Markets | 4↑ 6↓ | 5↑ 2↓ | — | +1 | -0.4 |
| SPY | S&P 500 | 4↑ 5↓ | 4↑ 2↓ | — | +1 | -0.6 |
| IWM | Russell 2000 | 2↑ 6↓ | 2↑ 1↓ | — | -3 | -1.1 |
| EWJ | Japan | 2↑ 5↓ | 1↓ | — | -4 | -1.4 |
| EFA | EAFE (Dev ex-US) | 6↓ | 1↓ | — | -7 | -1.8 |
| HYG | High Yield Corp | 4↓ | 1↑ 2↓ | — | -5 | -1.4 |
| USO | Oil (USO) | 3↑ | 1↑ 1↓ | — | +3 | +1.1 |
| GLD | Gold | 2↑ 2↓ | — | — | +0 | -0.4 |
| TLT | 20+ Year Treasury | 3↓ | — | — | -3 | -1.1 |
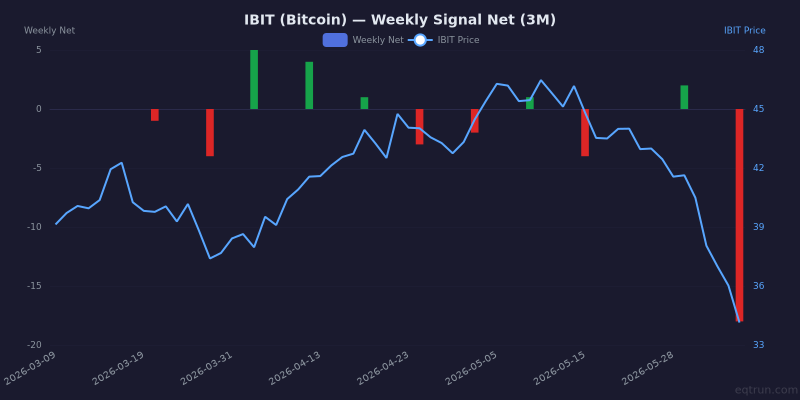
IBIT weekly net signals (bars) with IBIT price (blue line, right axis). 1Y z-score: -3.2.
Sector Breadth (Advance/Decline)
| Sector | Net | % Bullish | Z (1Y) |
|---|---|---|---|
| Energy | -72 | 48.5% | -0.3 |
| Financial Services | -181 | 49.0% | -0.3 |
| Utilities | -316 | 42.9% | -1.3 |
| Real Estate | -596 | 43.7% | -1.0 |
| Communication Services | -782 | 37.8% | -1.8 |
| Consumer Defensive | -963 | 40.8% | -1.5 |
| Consumer Cyclical | -1,632 | 42.7% | -1.0 |
| Basic Materials | -1,844 | 40.1% | -1.4 |
| Healthcare | -1,867 | 39.2% | -1.3 |
| Industrials | -2,575 | 42.9% | -1.0 |
| Technology | -2,806 | 39.4% | -1.3 |
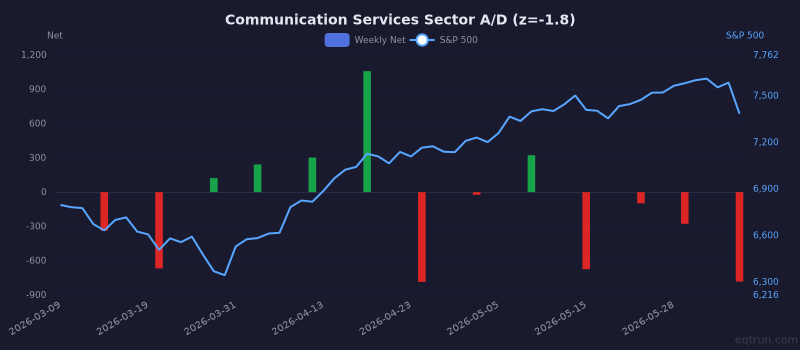
Communication Services sector weekly A/D net with S&P 500 price (right axis). 1Y z-score: -1.8.
What to Watch Next Week
- 200 DMA Breadth at -11,145. Continuing to weaken.
- Bollinger Band leading at +877. Watch for continuation vs exhaustion.
- MACD Breadth just flipped — need follow-through to confirm.
Last Week We Said
From our report on May 29:
- 🟡 S&P 500: Rallied +1.4% to 7,580, but breadth is not fully confirming. Price is moving up while internals remain mixed.
- 🟢 MSCI World (ACWI): Gained +1.6%, tracking US markets. The rally is global.
- 🟡 Breadth: Momentum is weak (2/6) while trend is in the mid-range (2/6). Short-term selling pressure within a mixed structural backdrop — below-average forward returns. Momentum just weakened — a fresh deterioration in short-term indicators.
What happened: S&P 500 fell -2.6% this week. The cautionary signals proved prescient.
Get this report in your inbox every Saturday
Free for all Chartlas users. Plus daily signal alerts, custom screens, PDF exports, and live breadth/regime dashboards.
Create free account →