Weekly Market Breadth Report — May 22, 2026
This report is AI-generated from Chartlas's market data and breadth analytics. It is not human-written market commentary and does not constitute investment advice.
Market Overview
S&P 500 was roughly flat this week (+0.9%) to 7,473. MSCI World (ACWI) gained +1.2% to 156. Momentum (3/6) and trend (2/6) are both in the mid-range — near-baseline forward returns historically. Best performer: DAX 40 (+3.9%). Weakest: Hang Seng (-1.4%).
| Metric | This Week | Last Week | 1Y Avg | Z (1Y) |
|---|---|---|---|---|
| Bullish Signal % | 46.5% | 43.3% | 55.9% | -1.3 |
| Bullish Signals | 117,717 | 119,233 | ||
| Bearish Signals | 135,343 | 156,421 |
This week's net balance skews bearish relative to the 1-year norm (z=-1.3).
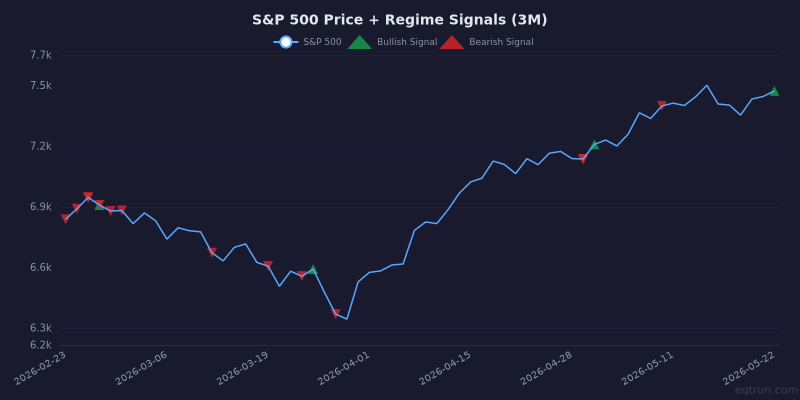
S&P 500 price with regime signal markers. Green triangles = bullish signals, red triangles = bearish signals.
Key Takeaways
- 🟡 S&P 500: Flat this week at 7,473 (+0.9%).
- 🟢 MSCI World (ACWI): Gained +1.2%, tracking US markets. The rally is global.
- 🟡 Breadth: Momentum improving while trend deteriorating — a divergence. Short-term bounce within structural weakness. Above-average forward returns historically, but direction is uncertain.
- 🔴 Breadth — Weekly Movers (±10%): At an extreme reading (z=-2.1). Uncommon weakness — could mark a washout or further downside.
- 🟢 S&P 500: McClellan Oscillator crossed above zero — breadth momentum shifted from negative to positive.
Stocks with the Most Signals
Large-cap stocks ($10B+) with 5+ signals fired this week.
| Symbol | Name | Sector | Signals | Net | 1W % |
|---|---|---|---|---|---|
| AMMN.JK | PT Amman Mineral Internasional | Basic Materials | 32 | -28 | -22% |
| DHER.DE | Delivery Hero SE | Consumer Cyclical | 30 | +26 | +14% |
| 6181.HK | Laopu Gold Co., Ltd. | Consumer Cyclical | 29 | -23 | -11% |
| ALAB | Astera Labs, Inc. | Technology | 28 | +18 | +32% |
| 2327.TW | Yageo Corporation | Technology | 26 | +22 | +38% |
| BXB.AX | Brambles Limited | Industrials | 26 | -20 | -23% |
| 002938.SZ | Avary Holding(Shenzhen)Co., Li | Technology | 26 | +18 | +21% |
| TPRO.MI | Technoprobe S.p.A. | Technology | 25 | +25 | +23% |
Momentum Breadth
Short-term oscillators and price velocity indicators.
| Index | This Week | Last Week | Change | Z (1Y) | Trend |
|---|---|---|---|---|---|
| Advance / Decline | +3,437 | -22,160 | +25,597 | +0.4 | Flipped bullish |
| New 20D High/Low | -11,406 | -6,025 | -5,381 | -2.0 | Weakening |
| MACD Breadth | -1,320 | -3,618 | +2,298 | -0.5 | Improving |
| RSI Extremes | +472 | -2,211 | +2,683 | +1.2 | Flipped bullish |
| Bollinger Band | +3,642 | -1,923 | +5,565 | +2.0 | Flipped bullish |
| Weekly Movers (±10%) | -4,719 | +2,679 | -7,398 | -2.1 | Flipped bearish |
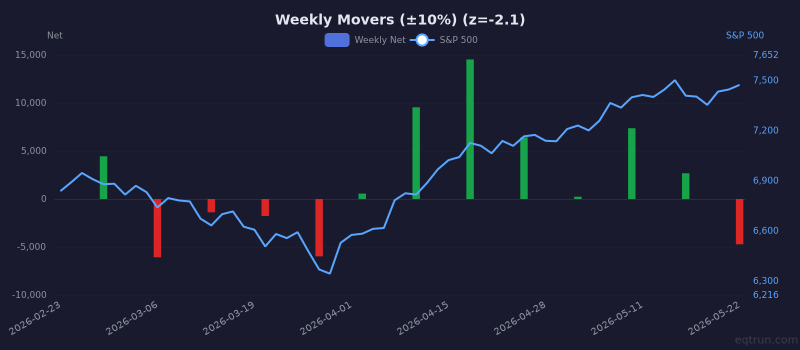
Weekly Movers (±10%) weekly net (bars) with S&P 500 price (right axis). 1Y z-score: -2.1.
Trend Breadth
Longer-term structural indicators.
| Index | This Week | Last Week | Change | Z (1Y) | Trend |
|---|---|---|---|---|---|
| 52-Week High/Low | -1,453 | +1,784 | -3,237 | -2.1 | Flipped bearish |
| Fresh 52W High/Low | -158 | +126 | -284 | -1.8 | Flipped bearish |
| 200 DMA Breadth | -4,899 | +4,238 | -9,137 | -1.5 | Flipped bearish |
| MA Cross (Golden/Death) | -141 | -303 | +162 | -0.6 | Improving |
| HH/HL Structure | +292 | +149 | +143 | -0.0 | Strengthening |
| Breakout / Breakdown | +101 | +278 | -177 | -1.2 | Deteriorating |
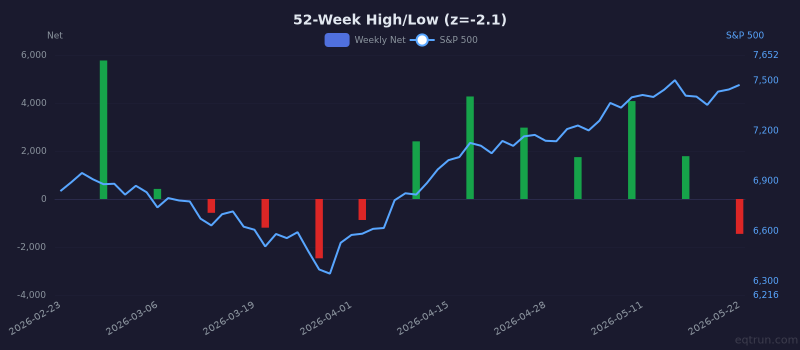
52-Week High/Low weekly net (bars) with S&P 500 price (right axis). 1Y z-score: -2.1.
Pattern Breadth
| Index | This Week | Last Week | Change | Z (1Y) | Trend |
|---|---|---|---|---|---|
| Double Top/Bottom | -518 | -332 | -186 | -2.0 | Weakening |
| Failed Pattern | -33 | -147 | +114 | -0.0 | Improving |
Major ETF Signals
| Ticker | Name | Momentum | Trend | Pattern | Net | Z (1Y) |
|---|---|---|---|---|---|---|
| TLT | 20+ Year Treasury | 5↑ 2↓ | 1↑ 5↓ | — | -1 | -0.5 |
| USO | Oil (USO) | 3↑ 4↓ | 4↑ 2↓ | — | +1 | +0.1 |
| HYG | High Yield Corp | 5↑ 4↓ | 1↑ | — | +2 | +0.3 |
| DIA | Dow Jones | 3↑ | 5↑ 2↓ | — | +6 | +1.2 |
| GLD | Gold | 5↑ 3↓ | 1↓ | — | +1 | -0.2 |
| QQQ | NASDAQ 100 | 3↓ | 3↑ 1↓ | — | -1 | -0.7 |
| IWM | Russell 2000 | 2↑ | 2↑ 1↓ | — | +3 | +0.3 |
| EFA | EAFE (Dev ex-US) | 1↓ | 2↑ 1↓ | — | +0 | -0.4 |
| EEM | Emerging Markets | — | 2↑ 1↓ | — | +1 | -0.3 |
| SPY | S&P 500 | 1↓ | 1↑ 1↓ | — | -1 | -0.9 |
| IBIT | Bitcoin | 1↑ | 1↓ | — | +0 | +0.0 |
| EWJ | Japan | 1↓ | 1↓ | — | -2 | -0.9 |
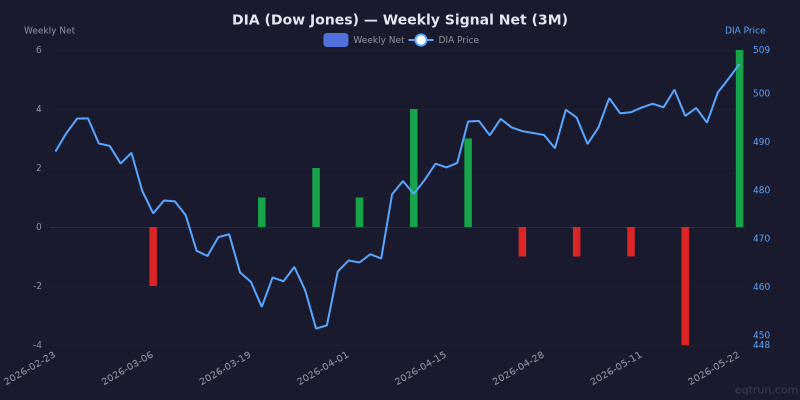
DIA weekly net signals (bars) with DIA price (blue line, right axis). 1Y z-score: +1.2.
Sector Breadth (Advance/Decline)
| Sector | Net | % Bullish | Z (1Y) |
|---|---|---|---|
| Technology | +1,918 | 57.0% | +1.1 |
| Financial Services | +715 | 53.8% | +0.5 |
| Industrials | +518 | 51.4% | +0.3 |
| Healthcare | +314 | 51.7% | +0.5 |
| Consumer Cyclical | +248 | 51.1% | +0.3 |
| Real Estate | +154 | 51.6% | +0.2 |
| Utilities | +153 | 53.4% | +0.6 |
| Basic Materials | +114 | 50.6% | +0.2 |
| Communication Services | -98 | 48.5% | -0.1 |
| Consumer Defensive | -288 | 47.4% | -0.3 |
| Energy | -399 | 41.8% | -1.4 |
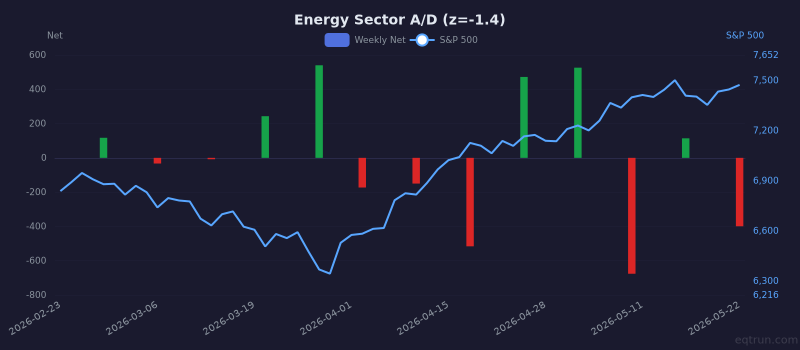
Energy sector weekly A/D net with S&P 500 price (right axis). 1Y z-score: -1.4.
What to Watch Next Week
- 200 DMA Breadth at -4,899. Continuing to weaken.
- Bollinger Band leading at +3,642. Watch for continuation vs exhaustion.
- Advance / Decline just flipped — need follow-through to confirm.
Last Week We Said
From our report on May 15:
- 🟡 S&P 500: Flat this week at 7,408 (+0.1%).
- 🟢 Breadth: Momentum is weak (1/6) while trend is strong (5/6). A pullback within an uptrend — historically associated with above-average forward returns.
- 🔴 Breadth — Advance / Decline: At an extreme reading (z=-2.0). Uncommon weakness — could mark a washout or further downside.
What happened: S&P 500 was flat (+0.9%). The mixed signals were warranted — no clear direction.
Get this report in your inbox every Saturday
Free for all Chartlas users. Plus daily signal alerts, custom screens, PDF exports, and live breadth/regime dashboards.
Create free account →