vwap_cross
VWAP Cross
Anchored Volume-Weighted Average Price cross. Bullish: close crosses above VWAP from below. Bearish: close crosses below VWAP from above. Uses rolling N-day anchored VWAP (typical price × volume / volume).
Signal family
Trend — Signals that fire when price is continuing or reversing an established directional move. Momentum-following by nature.
Parameters
| Name | Description | Default | Range |
|---|---|---|---|
| period | VWAP anchor window (days) | 20 | 5–100 |
Historical context
5,099,318 triggers on 24,035 tickers, 1995-09-06 → 2026-05-01. Universe: US large-cap (mcap ≥ $100,000,000, price ≥ $1). Long-only convention: BUY at open T+1, hold the horizon, compare to S&P 500 Equal Weight over the same window.
Methodology footnotes
Benchmarks shown in the detail tables: spxew (S&P 500 Equal Weight — primary, median-stock view, avoids the 2020+ megacap-concentration distortion), spx (S&P 500 cap-weighted, distorted post-2020), msci (MSCI World USD). Per-stock regime tags: trending = ADX(14) ≥ 25, high vol = 20d realized annualized vol ≥ 20%. 1d return = intraday T+1 open→close; 20d = open T+1 to close T+20.
At a glance — alpha vs S&P 500 Equal Weight, US-only
Holding-period sensitivity. Bullish columns: positive = signal worked (long the trigger beat the index). Bearish columns: negative = signal worked (the flagged stock underperformed).
| Horizon | Bullish α | Bearish α |
|---|---|---|
| 5-day | -0.05% | -0.00% |
| 20-day | -0.00% | +0.00% |
| 60-day | +0.27% | +0.27% |
| 1-year | +2.10% | +2.06% |
Sign flip across horizons. Bullish triggers go from -0.05% (5d) to +2.10% (1y) — short-term fade but longer holding recovers and wins. Bearish triggers go from -0.00% (5d) to +2.06% (1y) — short-term works as a sell signal but at 1-year horizon stocks mean-revert and outperform.
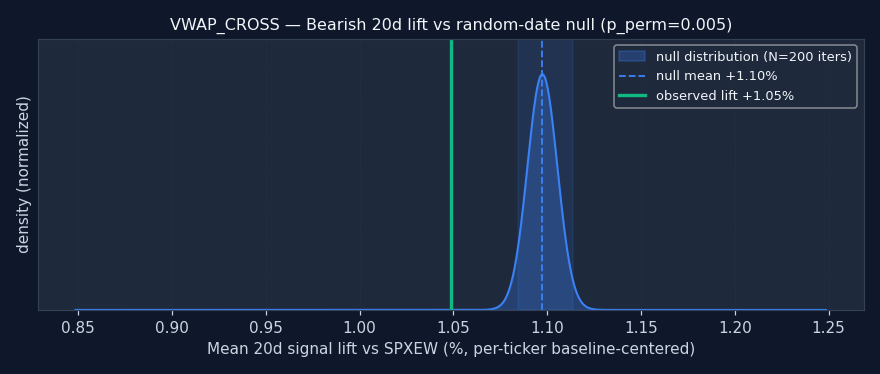
Bearish: beats random (p=0.005).
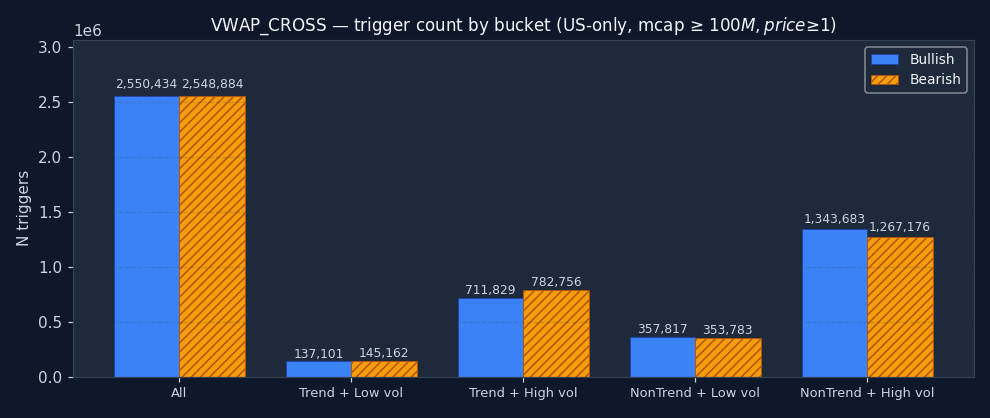
Where does VWAP_CROSS actually fire?
The bucket distribution often reveals what the signal really is, regardless of its textbook label. Heavy concentration in "non-trending + high vol" = it's mostly a chop-market event. Heavy in "trending + low vol" = it picks up the smooth grinds. Read the chart before the alpha numbers — context shapes everything that follows.
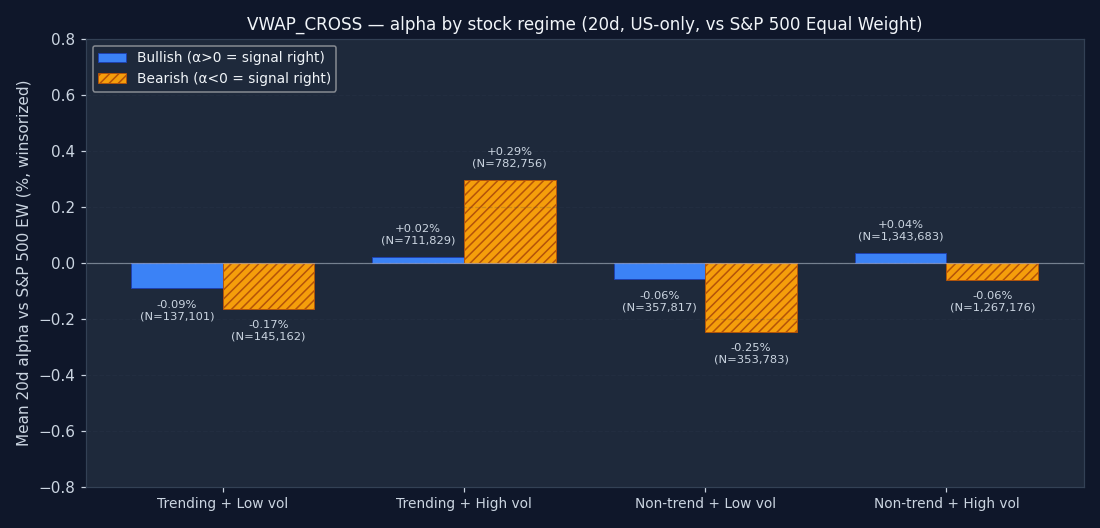
Does it work in every regime?
Trigger alpha split by the host stock's own regime on the trigger date — trending or ranging, high-vol or low-vol. The 20d alpha you'd actually capture if you took the trade. Bars matching your direction's "right" sign (green) = the signal worked in that regime; opposite sign = avoid it there. A signal with one strong-positive bar and three flat ones isn't a "20d alpha" signal — it's a "20d alpha when the stock is X" signal.
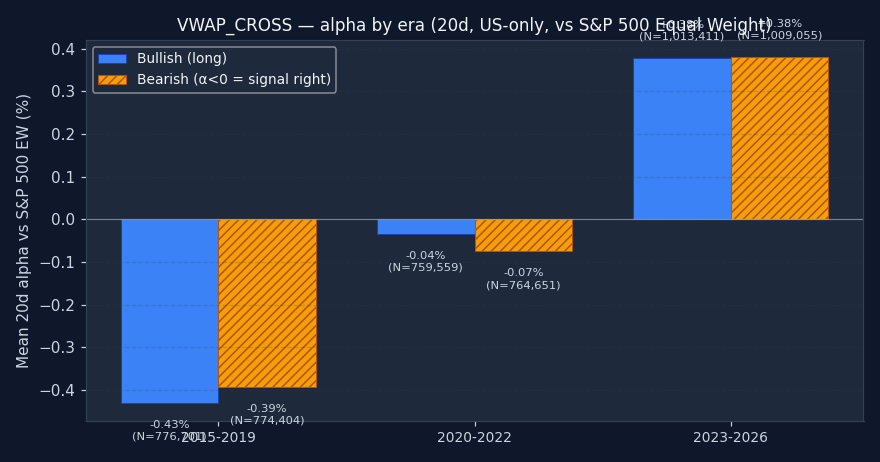
Does it work in every era?
A multi-year average can hide major instability. The sample splits into three windows: 2015–2019 (pre-COVID), 2020–2022 (pandemic + 2022 bear), and 2023+ (post-ZIRP + AI megacap rally). All three matching your direction's "right" sign = the signal is durable. One era doing all the work = a regime-specific edge that may not repeat. The bigger the variance across eras, the smaller the position you should run.
↑ Bullish triggers
| Bench | Metric | 1d | 5d | 20d | 60d | 252d |
|---|---|---|---|---|---|---|
| spx | Stock % | -0.01% | +0.19% | +0.87% | +2.71% | +12.21% |
| Bench % | +0.02% | +0.27% | +1.09% | +3.09% | +13.85% | |
| Alpha % | -0.04% | -0.08% | -0.19% | -0.41% | -1.67% | |
| Median alpha | -0.12% | -0.40% | -1.14% | -2.69% | -10.21% | |
| Hit rate (α>0) | 46.9% | 45.7% | 44.3% | 42.5% | 37.8% | |
| p (naive) | <0.001 | <0.001 | <0.001 | <0.001 | <0.001 | |
| p (HAC) | <0.001 | <0.001 | <0.001 | <0.001 | <0.001 | |
| N | 2,471,614 | 2,390,661 | 2,373,290 | 2,325,487 | 2,074,843 | |
| msci | Stock % | -0.01% | +0.19% | +0.87% | +2.71% | +12.21% |
| Bench % | +0.07% | +0.27% | +0.96% | +2.69% | +11.45% | |
| Alpha % | -0.07% | -0.08% | -0.06% | +0.02% | +0.60% | |
| Median alpha | -0.16% | -0.41% | -1.02% | -2.29% | -7.92% | |
| Hit rate (α>0) | 46.0% | 45.6% | 44.8% | 43.5% | 40.3% | |
| p (naive) | <0.001 | <0.001 | <0.001 | 0.0861 | <0.001 | |
| p (HAC) | <0.001 | <0.001 | <0.001 | 0.3986 | <0.001 | |
| N | 2,458,358 | 2,375,319 | 2,356,149 | 2,309,207 | 2,054,822 | |
| spxew | Stock % | -0.01% | +0.19% | +0.87% | +2.71% | +12.21% |
| Bench % | +0.05% | +0.24% | +0.91% | +2.44% | +10.17% | |
| Alpha % | -0.06% | -0.05% | -0.00% | +0.27% | +2.10% | |
| Median alpha | -0.13% | -0.35% | -0.91% | -1.97% | -6.33% | |
| Hit rate (α>0) | 46.7% | 46.3% | 45.5% | 44.4% | 42.0% | |
| p (naive) | <0.001 | <0.001 | 0.9314 | <0.001 | <0.001 | |
| p (HAC) | <0.001 | <0.001 | 0.9506 | <0.001 | <0.001 | |
| N | 2,454,135 | 2,364,928 | 2,343,133 | 2,297,582 | 2,044,886 |
Permutation null detail — all horizons × both benchmarks
| Horizon | Bench | Observed lift | Null mean | Null 95% CI | pperm |
|---|---|---|---|---|---|
| 1d | spx | +0.08% | +0.08% | [+0.08%, +0.09%] | 0.607 |
| 1d | msci | +0.08% | +0.09% | [+0.09%, +0.09%] | 1.000 |
| 1d | spxew | +0.08% | +0.08% | [+0.07%, +0.08%] | 0.532 |
| 5d | spx | +0.35% | +0.35% | [+0.35%, +0.36%] | 1.000 |
| 5d | msci | +0.34% | +0.36% | [+0.35%, +0.37%] | 1.000 |
| 5d | spxew | +0.33% | +0.34% | [+0.33%, +0.35%] | 0.925 |
| 20d | spx | +1.10% | +1.13% | [+1.11%, +1.14%] | 1.000 |
| 20d | msci | +1.12% | +1.14% | [+1.13%, +1.15%] | 1.000 |
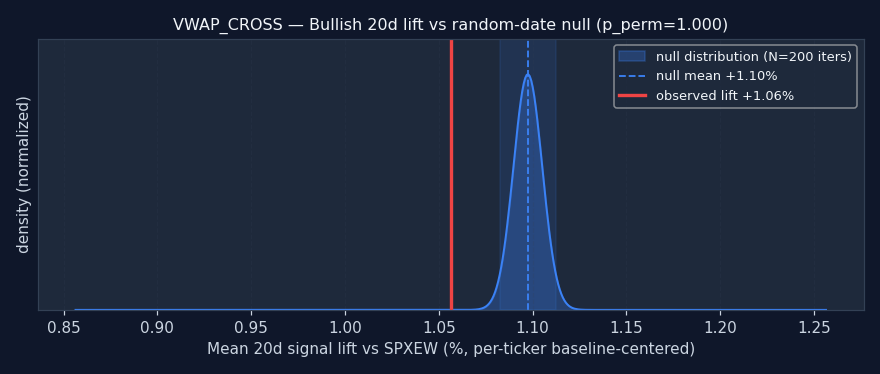
| 20d | spxew | +1.06% | +1.10% | [+1.08%, +1.11%] | 1.000 |
| 60d | spx | +2.43% | +2.43% | [+2.40%, +2.45%] | 0.478 |
| 60d | msci | +2.44% | +2.45% | [+2.42%, +2.47%] | 0.766 |
| 60d | spxew | +2.35% | +2.36% | [+2.34%, +2.39%] | 0.761 |
| 252d | spx | +5.04% | +4.93% | [+4.88%, +4.98%] | 0.005 |
| 252d | msci | +5.00% | +4.88% | [+4.83%, +4.92%] | 0.005 |
| 252d | spxew | +4.72% | +4.58% | [+4.53%, +4.63%] | 0.005 |
Example triggers on US large-caps (2023+, mcap ≥ $30B)
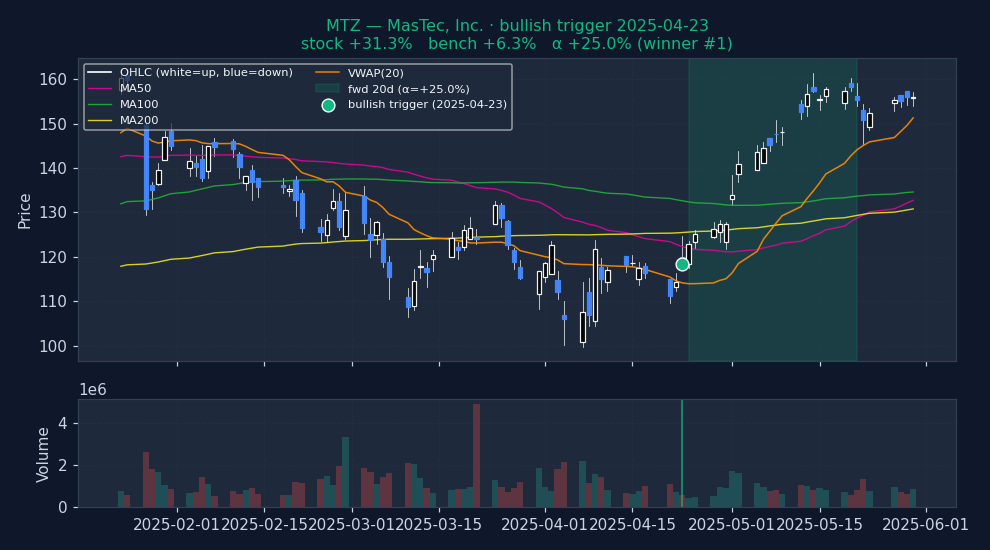
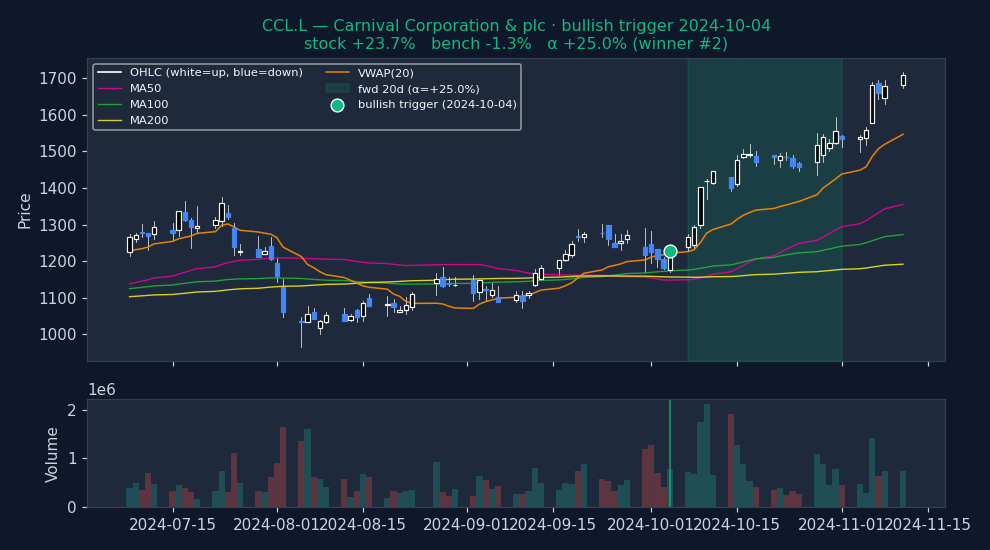
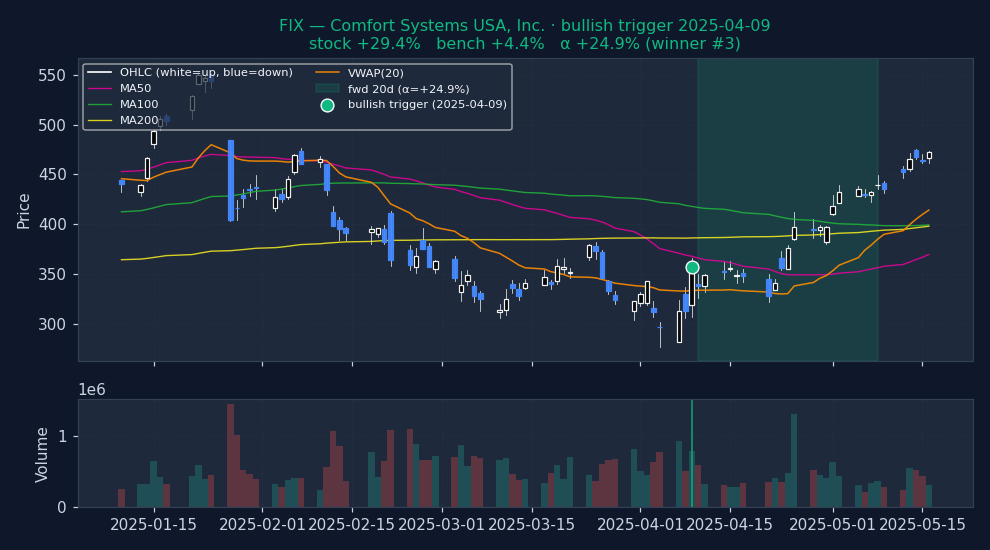
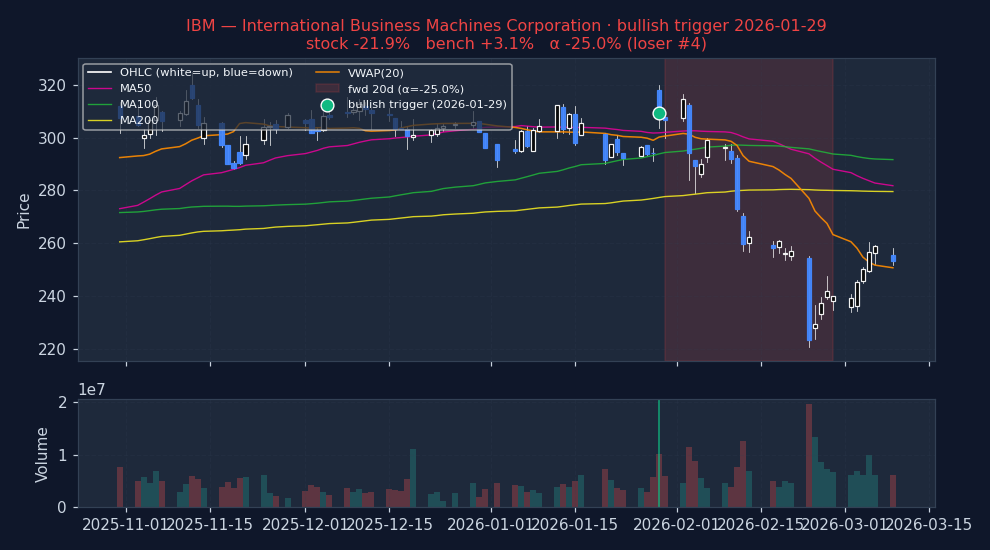
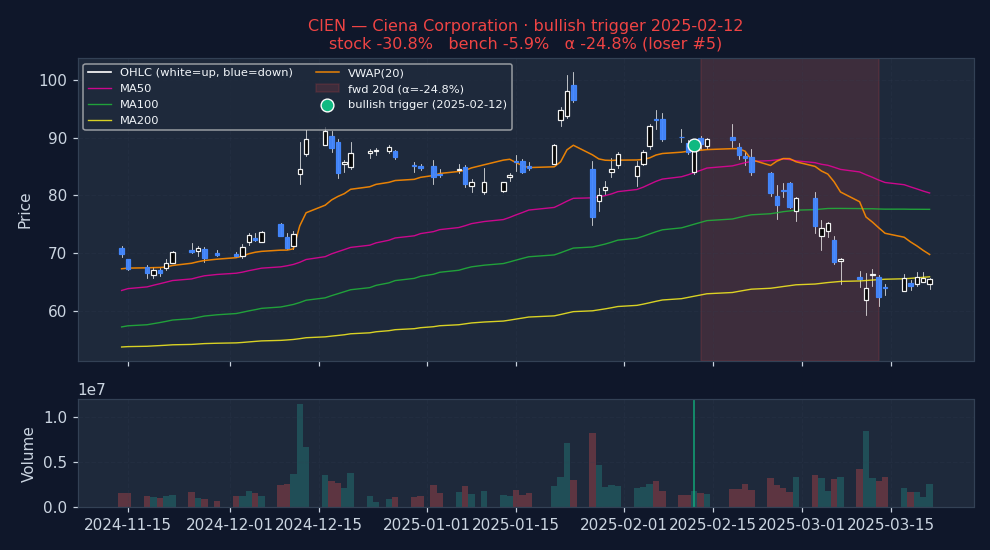
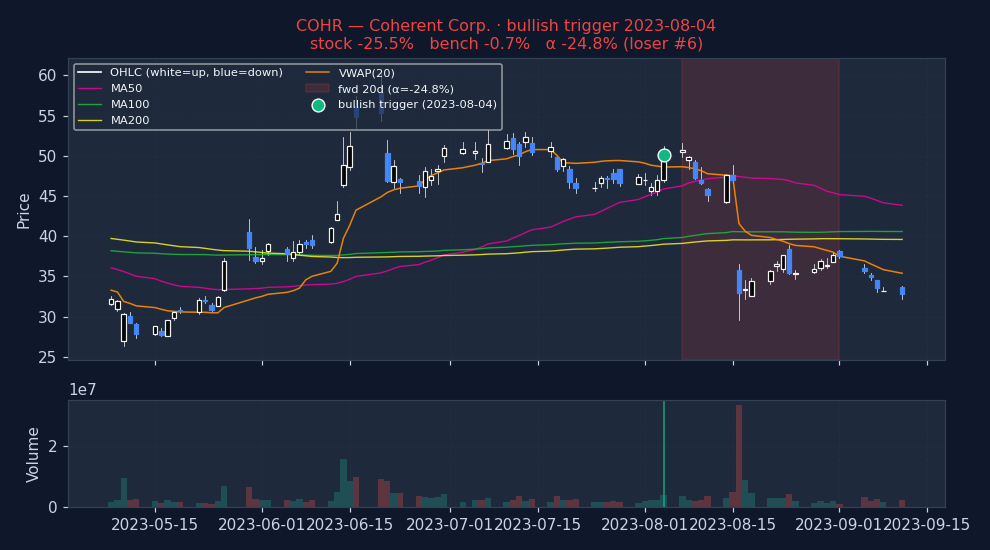
Six recent bullish VWAP_CROSS triggers on US mega-caps. Top three: the signal's best outcomes. Bottom three: the worst. Catalyst-driven outliers (|α| > 25%) excluded so what's left is the signal's own typical good and bad days, not earnings shocks.
Strongest outcomes (what VWAP_CROSS looks like when it works)
Weakest outcomes (what VWAP_CROSS looks like when it fails)
Stock-regime quadrants (2×2 per-stock, 20d alpha detail table)
| Quadrant | N | Stock % (spx) | Bench % (spx) | Alpha % (spx) | p (HAC) | Stock % (msci) | Bench % (msci) | Alpha % (msci) | p (HAC) | Stock % (spxew) | Bench % (spxew) | Alpha % (spxew) | p (HAC) |
|---|---|---|---|---|---|---|---|---|---|---|---|---|---|
| Trending + Low vol Clean directional grind, low whipsaw | 137,101 | +0.48% | +0.87% | -0.37% | <0.001 | +0.48% | +0.72% | -0.22% | <0.001 | +0.48% | +0.60% | -0.09% | <0.001 |
| Trending + High vol Crisis selloff or parabolic rally | 711,829 | +0.97% | +1.21% | -0.19% | <0.001 | +0.97% | +1.05% | -0.03% | 0.2019 | +0.97% | +1.02% | +0.02% | 0.3182 |
| Non-trending + Low vol Quiet chop, summer doldrums | 357,817 | +0.53% | +0.85% | -0.31% | <0.001 | +0.53% | +0.72% | -0.17% | <0.001 | +0.53% | +0.60% | -0.06% | <0.001 |
| Non-trending + High vol Classical "whipsaw zone" for momentum | 1,343,683 | +0.97% | +1.12% | -0.11% | <0.001 | +0.97% | +1.00% | -0.01% | 0.6849 | +0.97% | +0.97% | +0.04% | 0.0131 |
Sub-period breakdown table (20d alpha)
| Period | N | Alpha % (spx) | p (HAC) | Alpha % (msci) | p (HAC) | Alpha % (spxew) | p (HAC) |
|---|---|---|---|---|---|---|---|
| 2015-2019 2015-01-01 → 2020-01-01 | 776,701 | -0.59% | <0.001 | -0.41% | <0.001 | -0.43% | <0.001 |
| 2020-2022 2020-01-01 → 2023-01-01 | 759,559 | +0.27% | <0.001 | +0.38% | <0.001 | -0.04% | 0.0803 |
| 2023-2026 2023-01-01 → 2099-01-01 | 1,013,411 | -0.21% | <0.001 | -0.11% | <0.001 | +0.38% | <0.001 |
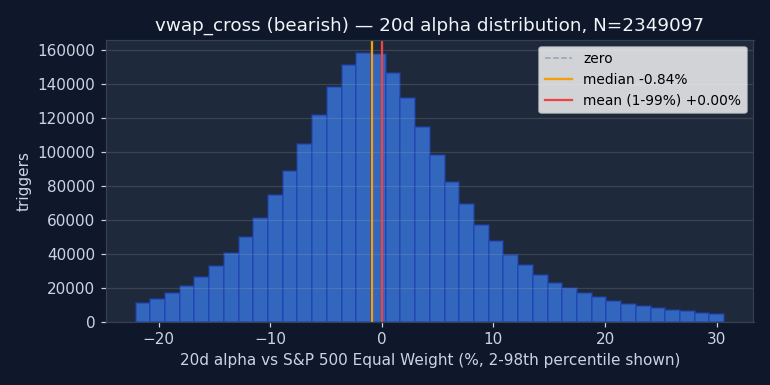
↓ Bearish triggers negative alpha = signal was right (stock underperformed market)
| Bench | Metric | 1d | 5d | 20d | 60d | 252d |
|---|---|---|---|---|---|---|
| spx | Stock % | -0.00% | +0.19% | +0.74% | +2.66% | +12.04% |
| Bench % | +0.01% | +0.21% | +0.99% | +3.12% | +13.76% | |
| Alpha % | -0.02% | -0.02% | -0.20% | -0.44% | -1.76% | |
| Median alpha | -0.05% | -0.27% | -1.09% | -2.65% | -10.18% | |
| Hit rate (α>0) | 48.6% | 47.0% | 44.5% | 42.6% | 37.8% | |
| p (naive) | <0.001 | <0.001 | <0.001 | <0.001 | <0.001 | |
| p (HAC) | <0.001 | <0.001 | <0.001 | <0.001 | <0.001 | |
| N | 2,471,895 | 2,390,993 | 2,374,724 | 2,316,999 | 2,074,131 | |
| msci | Stock % | -0.00% | +0.19% | +0.74% | +2.66% | +12.04% |
| Bench % | +0.03% | +0.21% | +0.87% | +2.72% | +11.41% | |
| Alpha % | -0.03% | -0.00% | -0.08% | -0.01% | +0.51% | |
| Median alpha | -0.07% | -0.26% | -0.96% | -2.24% | -7.91% | |
| Hit rate (α>0) | 48.0% | 47.1% | 45.0% | 43.6% | 40.3% | |
| p (naive) | <0.001 | 0.3624 | <0.001 | 0.6977 | <0.001 | |
| p (HAC) | <0.001 | 0.3929 | <0.001 | 0.8482 | 0.0002 | |
| N | 2,458,281 | 2,378,762 | 2,364,082 | 2,304,523 | 2,062,976 | |
| spxew | Stock % | -0.00% | +0.19% | +0.74% | +2.66% | +12.04% |
| Bench % | +0.04% | +0.19% | +0.81% | +2.44% | +10.06% | |
| Alpha % | -0.04% | -0.00% | +0.00% | +0.27% | +2.06% | |
| Median alpha | -0.07% | -0.24% | -0.84% | -1.89% | -6.29% | |
| Hit rate (α>0) | 48.2% | 47.4% | 45.7% | 44.6% | 42.0% | |
| p (naive) | <0.001 | 0.7074 | 0.8968 | <0.001 | <0.001 | |
| p (HAC) | <0.001 | 0.7249 | 0.9265 | <0.001 | <0.001 | |
| N | 2,449,308 | 2,362,695 | 2,349,097 | 2,289,866 | 2,049,617 |
Permutation null detail — all horizons × both benchmarks
| Horizon | Bench | Observed lift | Null mean | Null 95% CI | pperm |
|---|---|---|---|---|---|
| 1d | spx | +0.10% | +0.08% | [+0.08%, +0.09%] | 1.000 |
| 1d | msci | +0.11% | +0.09% | [+0.09%, +0.09%] | 1.000 |
| 1d | spxew | +0.09% | +0.08% | [+0.07%, +0.08%] | 1.000 |
| 5d | spx | +0.39% | +0.36% | [+0.35%, +0.36%] | 1.000 |
| 5d | msci | +0.40% | +0.36% | [+0.35%, +0.37%] | 1.000 |
| 5d | spxew | +0.37% | +0.34% | [+0.33%, +0.35%] | 1.000 |
| 20d | spx | +1.08% | +1.13% | [+1.11%, +1.14%] | 0.005 |
| 20d | msci | +1.09% | +1.14% | [+1.13%, +1.16%] | 0.005 |
| 20d | spxew | +1.05% | +1.10% | [+1.08%, +1.11%] | 0.005 |
| 60d | spx | +2.40% | +2.43% | [+2.40%, +2.45%] | 0.025 |
| 60d | msci | +2.42% | +2.45% | [+2.42%, +2.47%] | 0.025 |
| 60d | spxew | +2.36% | +2.36% | [+2.33%, +2.39%] | 0.413 |
| 252d | spx | +5.00% | +4.93% | [+4.87%, +4.98%] | 0.995 |
| 252d | msci | +4.96% | +4.88% | [+4.82%, +4.93%] | 0.995 |
| 252d | spxew | +4.72% | +4.58% | [+4.52%, +4.63%] | 1.000 |
Example triggers on US large-caps (2023+, mcap ≥ $30B)
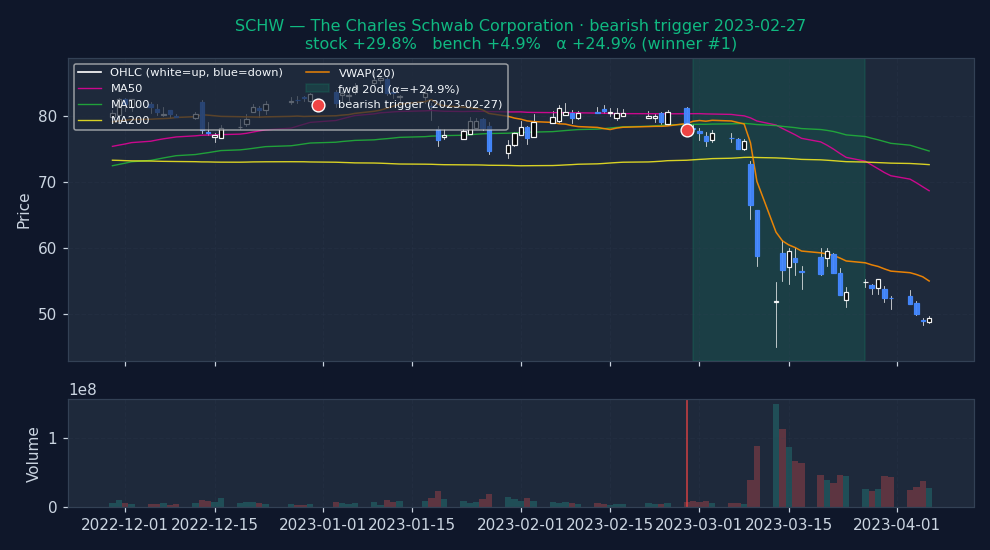
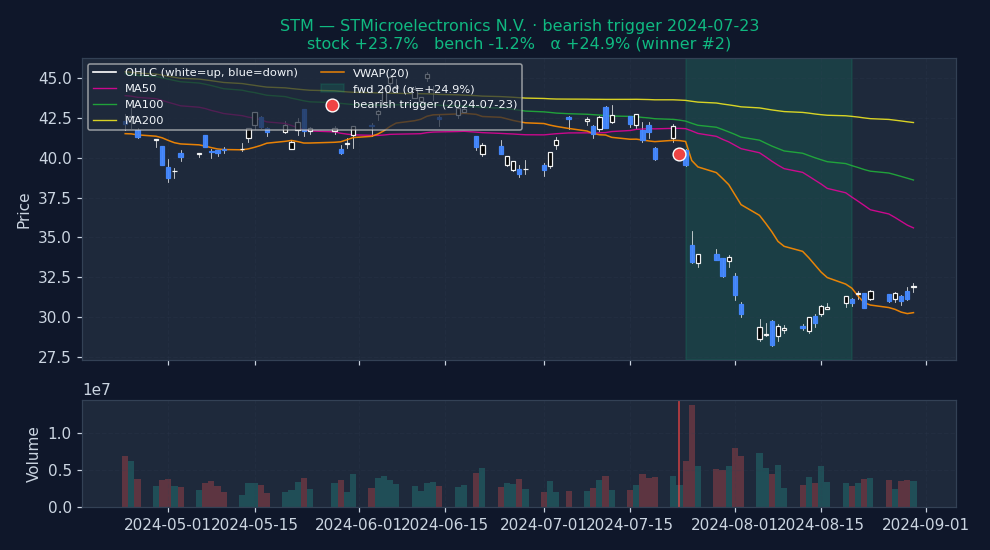
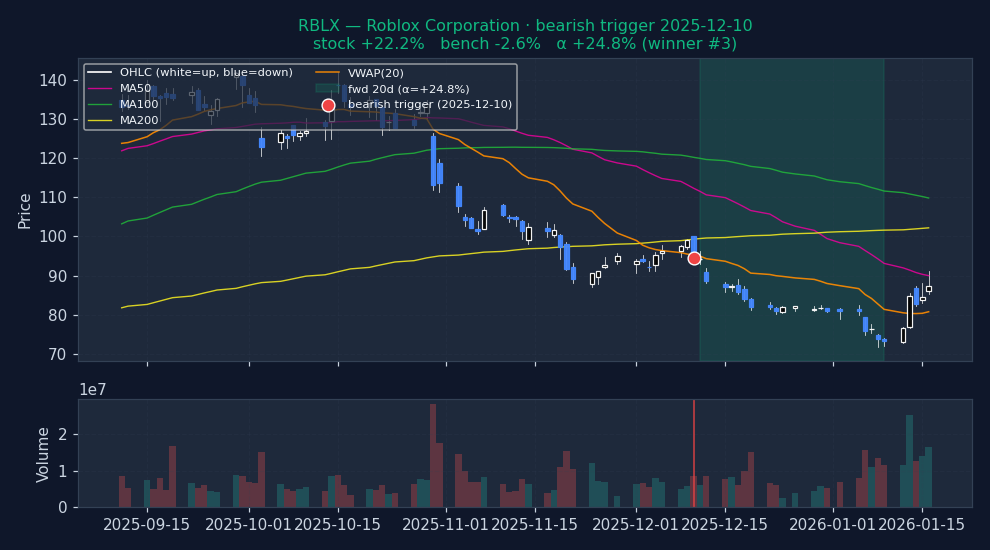
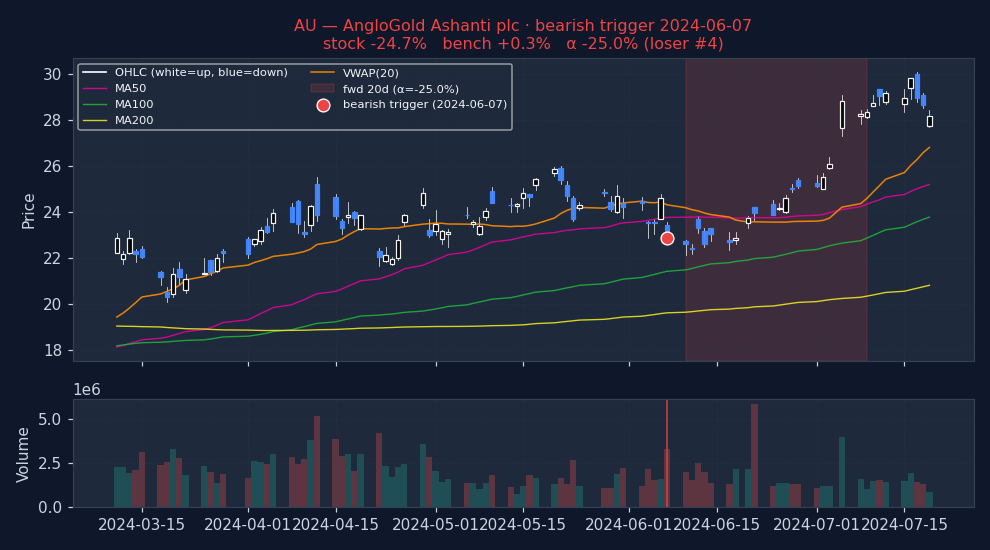
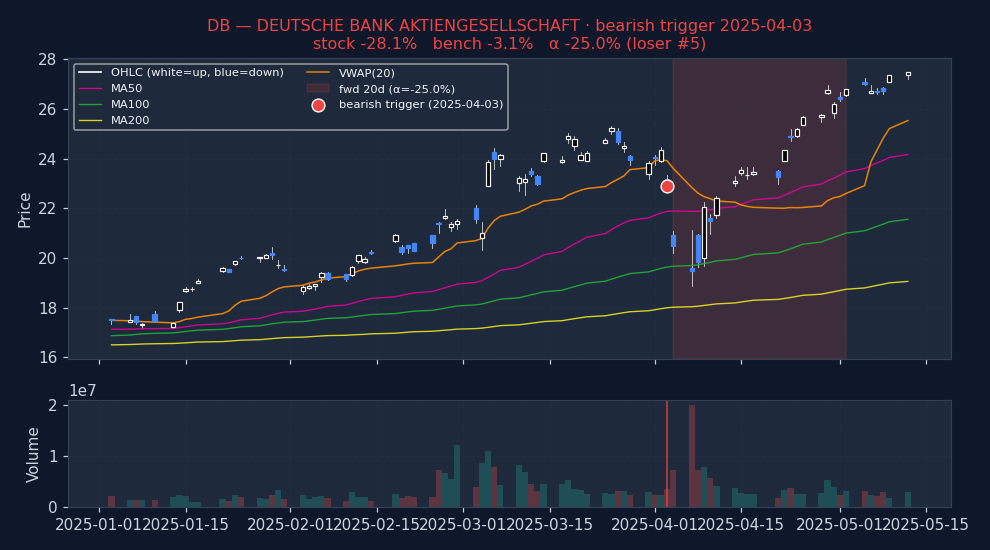
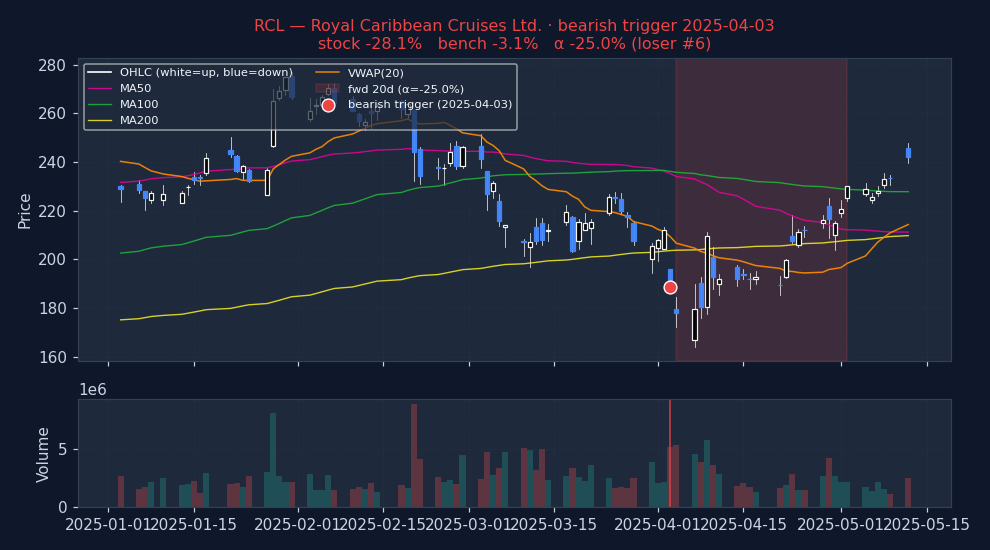
Six recent bearish VWAP_CROSS triggers on US mega-caps. Top three: the signal's best outcomes. Bottom three: the worst. Catalyst-driven outliers (|α| > 25%) excluded so what's left is the signal's own typical good and bad days, not earnings shocks.
Strongest outcomes (what VWAP_CROSS looks like when it works)
Weakest outcomes (what VWAP_CROSS looks like when it fails)
Stock-regime quadrants (2×2 per-stock, 20d alpha detail table)
| Quadrant | N | Stock % (spx) | Bench % (spx) | Alpha % (spx) | p (HAC) | Stock % (msci) | Bench % (msci) | Alpha % (msci) | p (HAC) | Stock % (spxew) | Bench % (spxew) | Alpha % (spxew) | p (HAC) |
|---|---|---|---|---|---|---|---|---|---|---|---|---|---|
| Trending + Low vol Clean directional grind, low whipsaw | 145,162 | +0.34% | +0.85% | -0.48% | <0.001 | +0.34% | +0.69% | -0.31% | <0.001 | +0.34% | +0.55% | -0.17% | <0.001 |
| Trending + High vol Crisis selloff or parabolic rally | 782,756 | +1.02% | +1.04% | +0.04% | 0.0622 | +1.02% | +0.89% | +0.18% | <0.001 | +1.02% | +0.81% | +0.29% | <0.001 |
| Non-trending + Low vol Quiet chop, summer doldrums | 353,783 | +0.34% | +0.87% | -0.50% | <0.001 | +0.34% | +0.73% | -0.35% | <0.001 | +0.34% | +0.63% | -0.25% | <0.001 |
| Non-trending + High vol Classical "whipsaw zone" for momentum | 1,267,176 | +0.77% | +1.02% | -0.20% | <0.001 | +0.77% | +0.92% | -0.10% | <0.001 | +0.77% | +0.88% | -0.06% | <0.001 |
Sub-period breakdown table (20d alpha)
| Period | N | Alpha % (spx) | p (HAC) | Alpha % (msci) | p (HAC) | Alpha % (spxew) | p (HAC) |
|---|---|---|---|---|---|---|---|
| 2015-2019 2015-01-01 → 2020-01-01 | 774,404 | -0.57% | <0.001 | -0.38% | <0.001 | -0.39% | <0.001 |
| 2020-2022 2020-01-01 → 2023-01-01 | 764,651 | +0.20% | <0.001 | +0.30% | <0.001 | -0.07% | <0.001 |
| 2023-2026 2023-01-01 → 2099-01-01 | 1,009,055 | -0.20% | <0.001 | -0.12% | <0.001 | +0.38% | <0.001 |
Methodology and caveats
How to read. Entry at open of T+1 (one trading day after the signal fires on close of T). 20d = open T+1 to close T+20. Alpha = stock return − benchmark return over the same window (Convention A, single-sided, textbook). For bullish triggers, POSITIVE alpha = signal was right. For bearish triggers, NEGATIVE alpha = signal was right (stock underperformed market). No sign-flipping; the direction of the bet determines what "good" looks like. Per-stock regime is each stock's own ADX(14) and RV(20) at the trigger date — not market-wide state.
Three p-values, three robustness tests. (a) p_naive: scipy one-sample t-test on winsorized alphas. Optimistic because overlapping 20d windows on the same ticker inflate effective N. (b) p_hac: Newey-West HAC with lag = horizon — corrects for the overlap and is the academic-finance standard. (c) p_perm: fraction of 200 random-date null iterations with mean ≥ observed. Tests whether the signal beats random date selection at all. A signal that clears all three (pnaive, phac, pperm all < 0.05) has real information; a signal that fails pperm has zero edge even if the t-test says "significant."
Caveats. (i) Universe reflects today's active tickers; delisted losers pruned → survivorship bias. (ii) Mcap ≥ $100M filter uses today's snapshot, not point-in-time — mild lookahead on which stocks enter the sample, not on returns. (iii) Means and p-values use winsorized alphas (1/99 percentile) to prevent data errors from dominating. Medians and hit rates use raw data. (iv) Zero transaction costs assumed. Realistic bid-ask + commissions remove 20–40bps from 20d alpha on US large-caps, more on small-cap. Sub-20bps alpha is noise in practice. (v) Past performance does not predict future results.
How to use this
1 · When to reach for this signal
Caution recommended. Bullish 20d alpha is -0.19% and worse than random — triggering on random dates would have produced better long-side returns. Either direction fails the "beats random" test. Don't use VWAP Cross as a standalone entry trigger. It may still be useful as part of a composite (section 4).
2 · When it works — the setups that drive it
- Best bullish setup: Non-trending + High vol — alpha -0.11% / 20d on 1,343,683 historical triggers.
- Best bearish setup: Trending + High vol — alpha +0.04% / 20d on 782,756 historical triggers.
- Best era for bullish: 2020-2022 — alpha +0.27% / 20d.
- Best era for bearish: 2020-2022 — alpha +0.20% / 20d.
3 · When it fails — common false positives
- Weakest bullish cell: Trending + Low vol — alpha -0.37% / 20d on 137,101 triggers.
- Weakest bearish cell: Non-trending + Low vol — alpha -0.50% / 20d on 353,783 triggers.
- Worst era for bullish: 2015-2019 — alpha -0.59% / 20d.
- Worst era for bearish: 2015-2019 — alpha -0.57% / 20d.
Signal-specific failure patterns
4 · Pairing inside a screen
The statements below describe how this signal relates to others by construction — which indicator family it belongs to, and where same-family redundancy might reduce the independence of evidence inside a Daily Report. These are taxonomic classifications drawn from standard technical-analysis texts; they are not pairing backtests. A multi-signal convergence backtest is planned but not yet run.
No classical-TA family-redundancy claim applies to this signal. Pairing behaviour is a backtest question and has not been measured yet.
What would likely rescue this signal
This block calls out the data or conditions that could turn a technically weak signal into a usable one in a composite screen. Based on signal mechanics and the observed failure patterns above; individual combinations are not yet backtested.
- Multi-day VWAP structure — A 5-day sustained close above/below VWAP is structurally more meaningful than the single-day cross. Parameter change, testable.
- Pair with trend filter — Bearish VWAP cross below 50DMA is an aligned breakdown. Above 50DMA is a possible pullback in uptrend. Separating the two regimes would clarify which cells carry real alpha.
See also Why technical-only signals don't survive on their own for the broader argument.
5 · Before you act — a 5-point checklist
- Normal trading day? Rule out earnings (within ±3 days), ex-dividend, or known corporate-action dates — the signal is almost certainly reading noise, not momentum, in those windows.
- Where is price vs its own 50 / 200 DMA? A trend signal is only as credible as the underlying trend it claims to confirm. Check the 200DMA orientation before acting.
- What's the sector breadth doing? An isolated signal in a broadly down-trending sector is a lower-confidence setup than one firing with the rest of its peer group.
- Is ADV20 enough for your size? If the trigger is on a $500M name and you want to move $1M notional, you're the tape. Consider adv20d ≥ 5% of your intended position.
- What invalidates you? Define a price level (for longs: a close below the trigger-day low; for shorts: close above the trigger-day high) and honor it. The backtest alpha is an average; any one trade can be at either tail.
Execution notes
Bearish side is the tradable direction; bullish side is noise. The 60-day column on the at-a-glance is roughly twice the 20-day for the bearish side — hold through. Entry open T+1.