williams_r
Williams %R
Range: -100 to 0. Bullish: %R crosses above oversold (-80) from below. Bearish: %R crosses below overbought (-20) from above.
Signal family
Mean reversion — Oscillator-based signals that fire at overbought or oversold extremes — typically fade the prevailing move.
Parameters
| Name | Description | Default | Range |
|---|---|---|---|
| period | Lookback period | 14 | 5–50 |
| overbought | Overbought level | -20 | -30–-10 |
| oversold | Oversold level | -80 | -90–-70 |
Historical context
5,522,997 triggers on 24,258 tickers, 1995-09-06 → 2026-05-01. Universe: US large-cap (mcap ≥ $100,000,000, price ≥ $1). Long-only convention: BUY at open T+1, hold the horizon, compare to S&P 500 Equal Weight over the same window.
Methodology footnotes
Benchmarks shown in the detail tables: spxew (S&P 500 Equal Weight — primary, median-stock view, avoids the 2020+ megacap-concentration distortion), spx (S&P 500 cap-weighted, distorted post-2020), msci (MSCI World USD). Per-stock regime tags: trending = ADX(14) ≥ 25, high vol = 20d realized annualized vol ≥ 20%. 1d return = intraday T+1 open→close; 20d = open T+1 to close T+20.
At a glance — alpha vs S&P 500 Equal Weight, US-only
Holding-period sensitivity. Bullish columns: positive = signal worked (long the trigger beat the index). Bearish columns: negative = signal worked (the flagged stock underperformed).
| Horizon | Bullish α | Bearish α |
|---|---|---|
| 5-day | -0.07% | +0.00% |
| 20-day | -0.12% | +0.15% |
| 60-day | +0.17% | +0.40% |
| 1-year | +1.54% | +2.40% |
Sign flip across horizons. Bullish triggers go from -0.07% (5d) to +1.54% (1y) — short-term fade but longer holding recovers and wins.
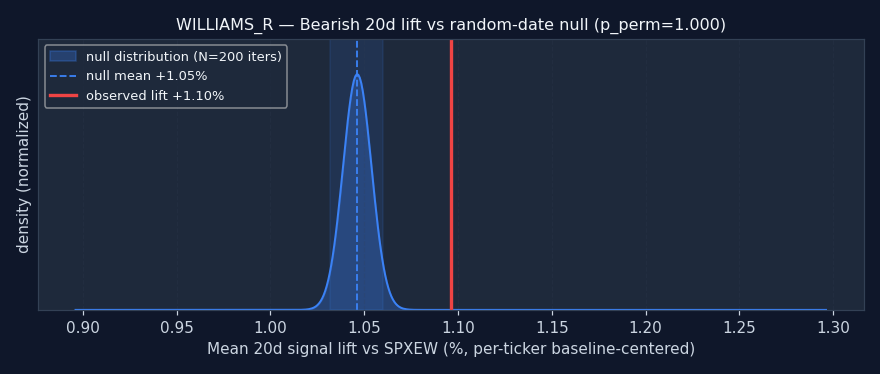
Bearish: worse than random (p=1.000).
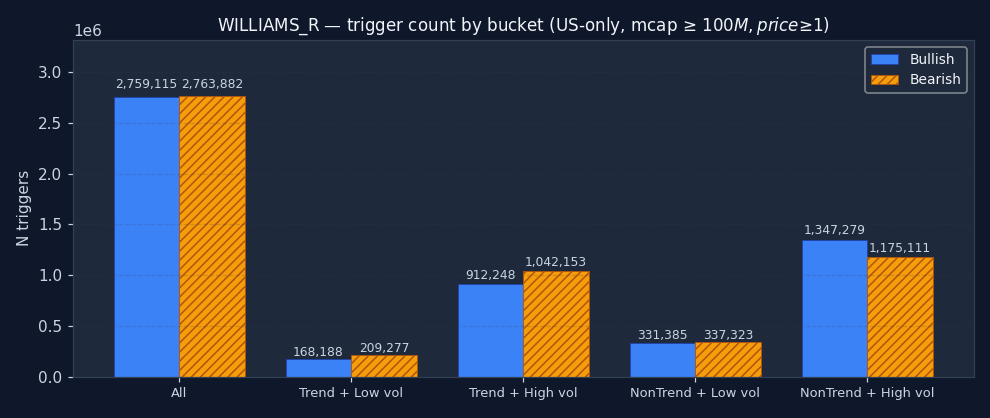
Where does WILLIAMS_R actually fire?
The bucket distribution often reveals what the signal really is, regardless of its textbook label. Heavy concentration in "non-trending + high vol" = it's mostly a chop-market event. Heavy in "trending + low vol" = it picks up the smooth grinds. Read the chart before the alpha numbers — context shapes everything that follows.
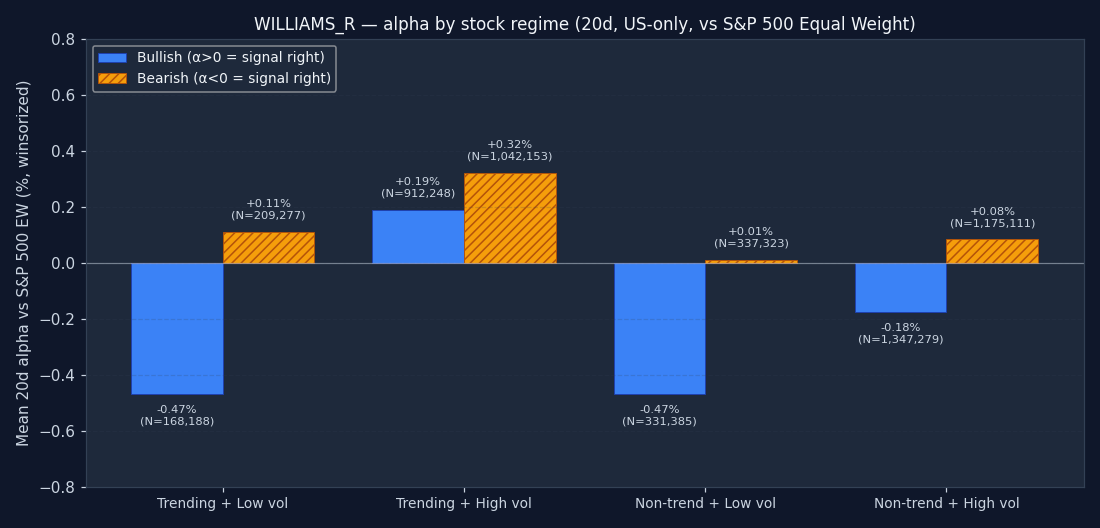
Does it work in every regime?
Trigger alpha split by the host stock's own regime on the trigger date — trending or ranging, high-vol or low-vol. The 20d alpha you'd actually capture if you took the trade. Bars matching your direction's "right" sign (green) = the signal worked in that regime; opposite sign = avoid it there. A signal with one strong-positive bar and three flat ones isn't a "20d alpha" signal — it's a "20d alpha when the stock is X" signal.
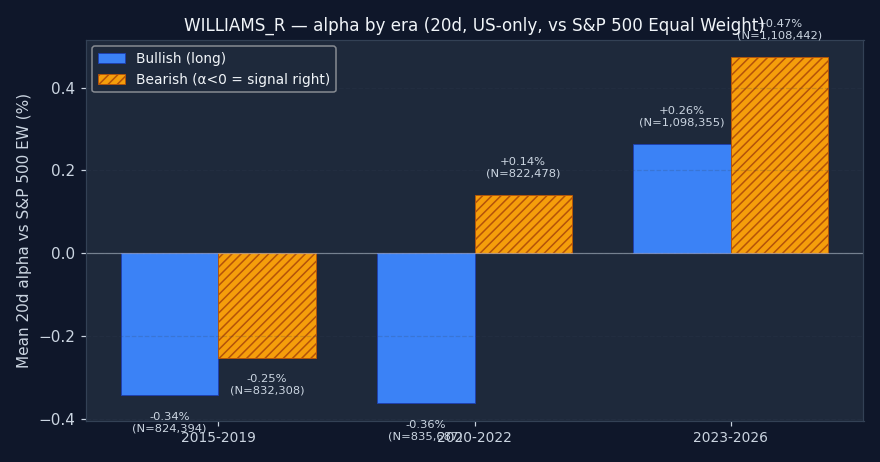
Does it work in every era?
A multi-year average can hide major instability. The sample splits into three windows: 2015–2019 (pre-COVID), 2020–2022 (pandemic + 2022 bear), and 2023+ (post-ZIRP + AI megacap rally). All three matching your direction's "right" sign = the signal is durable. One era doing all the work = a regime-specific edge that may not repeat. The bigger the variance across eras, the smaller the position you should run.
↑ Bullish triggers
| Bench | Metric | 1d | 5d | 20d | 60d | 252d |
|---|---|---|---|---|---|---|
| spx | Stock % | -0.01% | +0.16% | +0.96% | +2.94% | +12.11% |
| Bench % | +0.01% | +0.24% | +1.30% | +3.33% | +14.24% | |
| Alpha % | -0.04% | -0.11% | -0.33% | -0.41% | -2.17% | |
| Median alpha | -0.11% | -0.35% | -1.19% | -2.63% | -10.71% | |
| Hit rate (α>0) | 47.3% | 46.2% | 44.1% | 42.8% | 37.5% | |
| p (naive) | <0.001 | <0.001 | <0.001 | <0.001 | <0.001 | |
| p (HAC) | <0.001 | <0.001 | <0.001 | <0.001 | <0.001 | |
| N | 2,679,499 | 2,593,038 | 2,581,973 | 2,510,619 | 2,269,996 | |
| msci | Stock % | -0.01% | +0.16% | +0.96% | +2.94% | +12.11% |
| Bench % | +0.06% | +0.26% | +1.14% | +2.97% | +11.85% | |
| Alpha % | -0.07% | -0.11% | -0.20% | -0.01% | -0.07% | |
| Median alpha | -0.14% | -0.37% | -1.07% | -2.28% | -8.51% | |
| Hit rate (α>0) | 46.4% | 46.0% | 44.6% | 43.7% | 39.8% | |
| p (naive) | <0.001 | <0.001 | <0.001 | 0.2549 | 0.0273 | |
| p (HAC) | <0.001 | <0.001 | <0.001 | 0.5771 | 0.5800 | |
| N | 2,662,426 | 2,572,370 | 2,548,646 | 2,491,323 | 2,244,934 | |
| spxew | Stock % | -0.01% | +0.16% | +0.96% | +2.94% | +12.11% |
| Bench % | +0.04% | +0.21% | +1.09% | +2.76% | +10.48% | |
| Alpha % | -0.06% | -0.07% | -0.12% | +0.17% | +1.54% | |
| Median alpha | -0.12% | -0.30% | -0.94% | -1.99% | -6.89% | |
| Hit rate (α>0) | 47.0% | 46.8% | 45.3% | 44.4% | 41.5% | |
| p (naive) | <0.001 | <0.001 | <0.001 | <0.001 | <0.001 | |
| p (HAC) | <0.001 | <0.001 | <0.001 | <0.001 | <0.001 | |
| N | 2,662,708 | 2,572,563 | 2,546,037 | 2,483,251 | 2,239,567 |
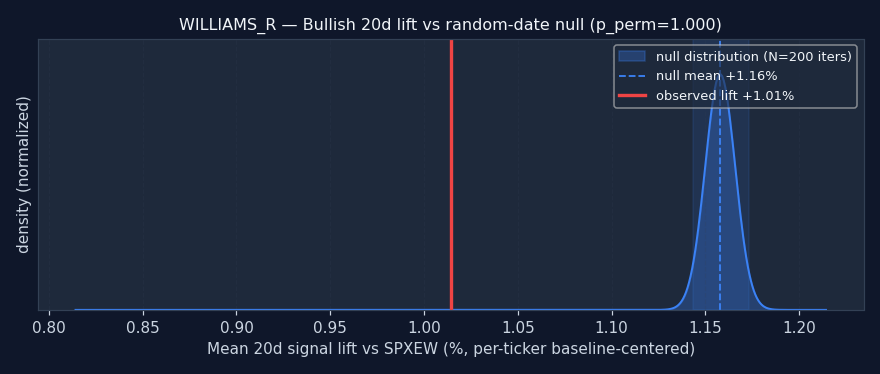
Permutation null detail — all horizons × both benchmarks
| Horizon | Bench | Observed lift | Null mean | Null 95% CI | pperm |
|---|---|---|---|---|---|
| 1d | spx | +0.08% | +0.09% | [+0.08%, +0.09%] | 1.000 |
| 1d | msci | +0.08% | +0.09% | [+0.09%, +0.09%] | 1.000 |
| 1d | spxew | +0.08% | +0.08% | [+0.08%, +0.08%] | 0.005 |
| 5d | spx | +0.33% | +0.37% | [+0.36%, +0.38%] | 1.000 |
| 5d | msci | +0.32% | +0.38% | [+0.37%, +0.38%] | 1.000 |
| 5d | spxew | +0.33% | +0.36% | [+0.35%, +0.36%] | 1.000 |
| 20d | spx | +1.03% | +1.19% | [+1.17%, +1.20%] | 1.000 |
| 20d | msci | +1.04% | +1.20% | [+1.19%, +1.22%] | 1.000 |
| 20d | spxew | +1.01% | +1.16% | [+1.14%, +1.17%] | 1.000 |
| 60d | spx | +2.66% | +2.55% | [+2.52%, +2.57%] | 0.005 |
| 60d | msci | +2.64% | +2.57% | [+2.54%, +2.60%] | 0.005 |
| 60d | spxew | +2.49% | +2.48% | [+2.46%, +2.51%] | 0.174 |
| 252d | spx | +5.32% | +5.16% | [+5.11%, +5.21%] | 0.005 |
| 252d | msci | +5.15% | +5.11% | [+5.06%, +5.15%] | 0.050 |
| 252d | spxew | +4.97% | +4.82% | [+4.77%, +4.86%] | 0.005 |
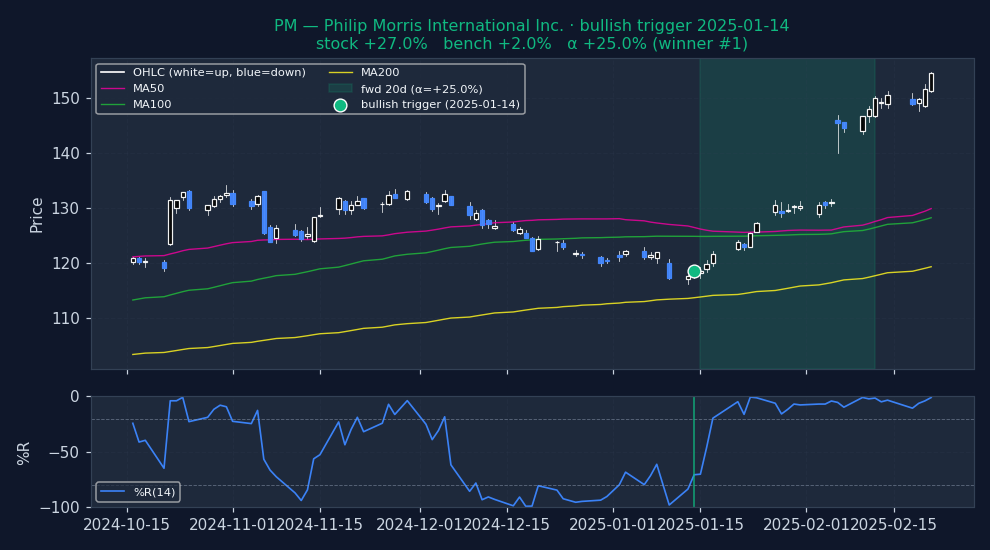
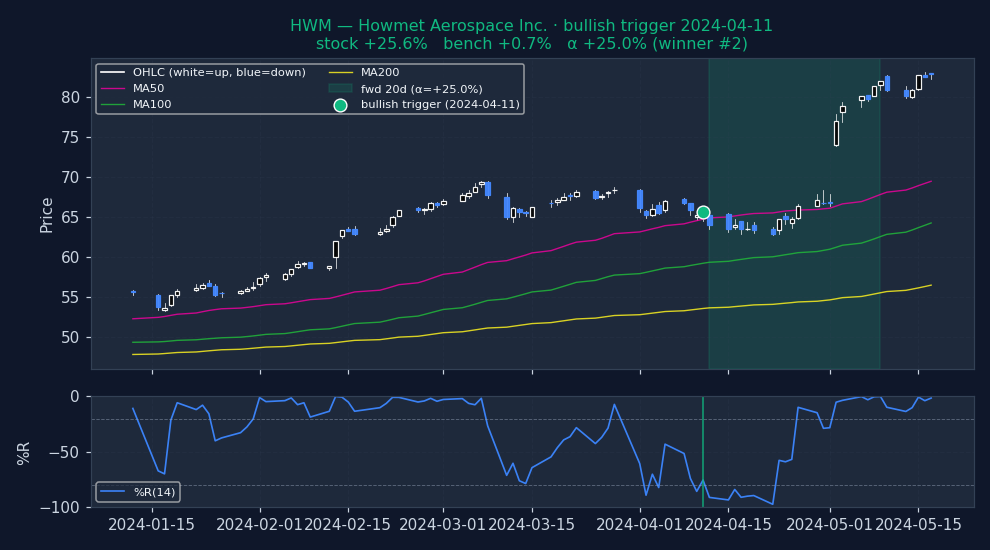
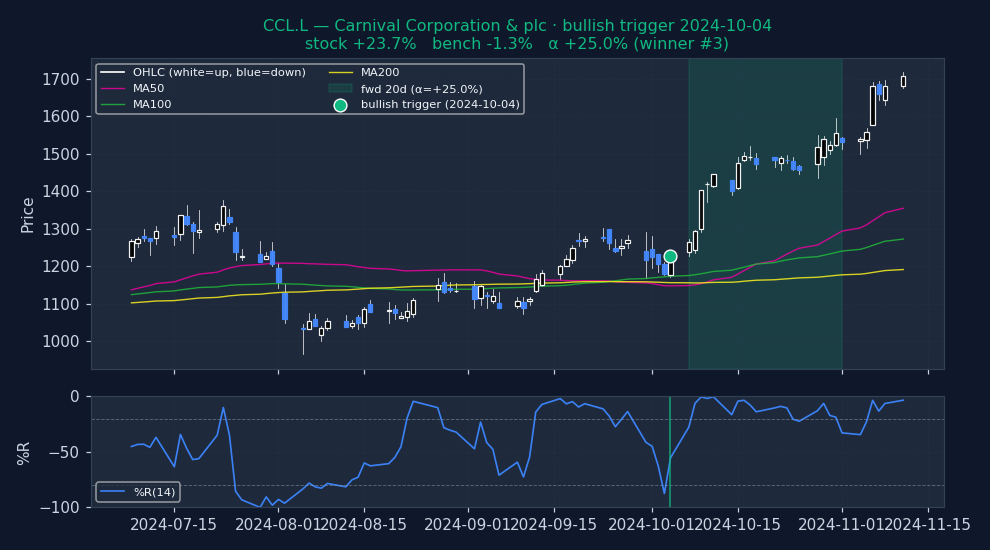
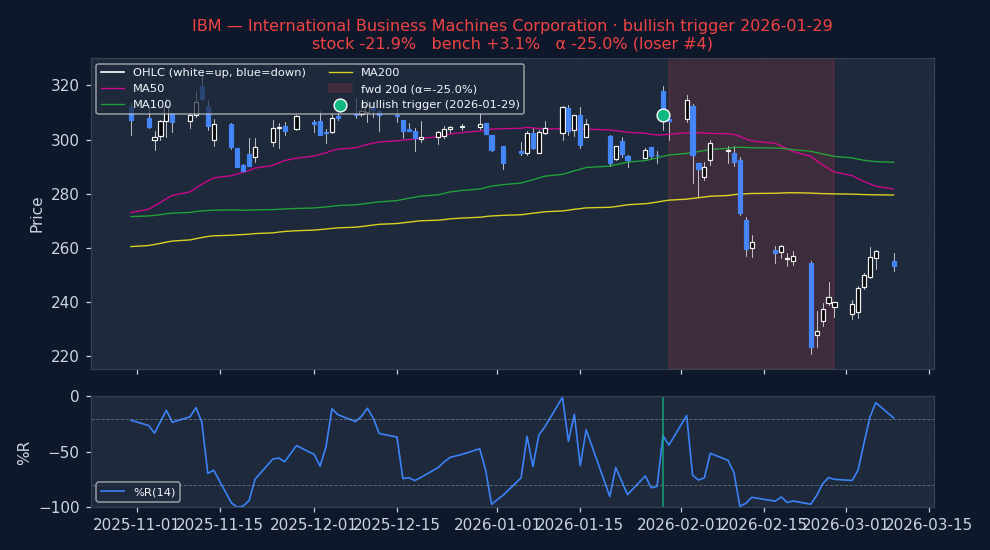
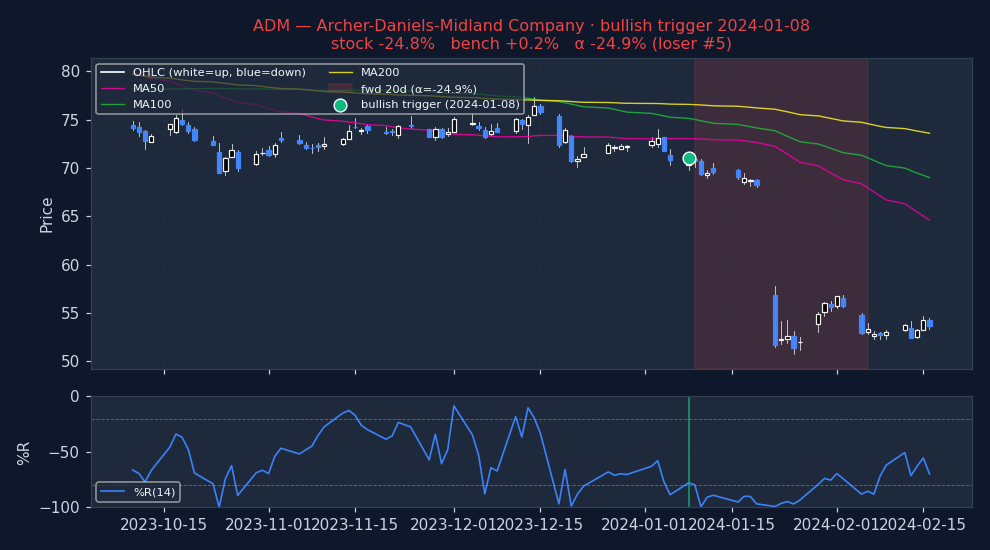
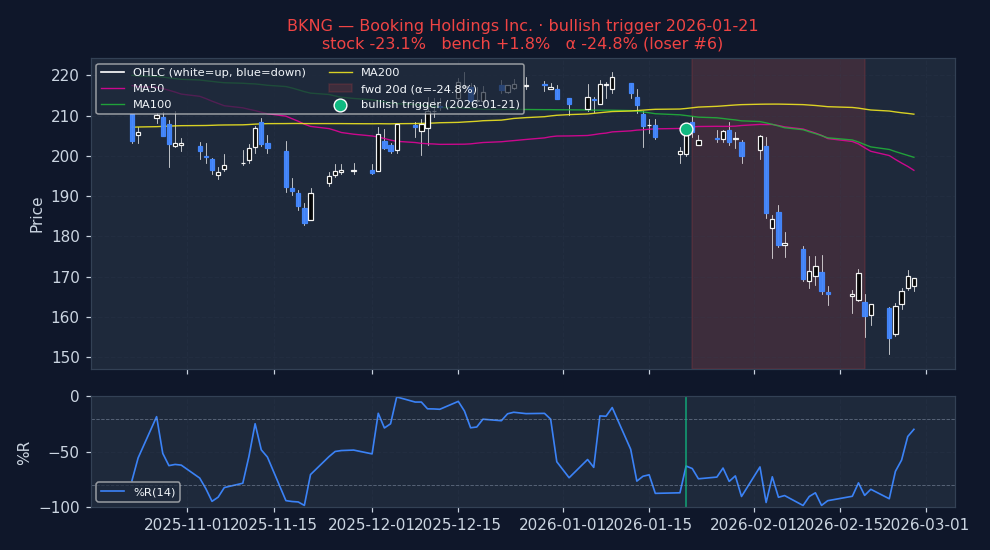
Example triggers on US large-caps (2023+, mcap ≥ $30B)
Six recent bullish WILLIAMS_R triggers on US mega-caps. Top three: the signal's best outcomes. Bottom three: the worst. Catalyst-driven outliers (|α| > 25%) excluded so what's left is the signal's own typical good and bad days, not earnings shocks.
Strongest outcomes (what WILLIAMS_R looks like when it works)
Weakest outcomes (what WILLIAMS_R looks like when it fails)
Stock-regime quadrants (2×2 per-stock, 20d alpha detail table)
| Quadrant | N | Stock % (spx) | Bench % (spx) | Alpha % (spx) | p (HAC) | Stock % (msci) | Bench % (msci) | Alpha % (msci) | p (HAC) | Stock % (spxew) | Bench % (spxew) | Alpha % (spxew) | p (HAC) |
|---|---|---|---|---|---|---|---|---|---|---|---|---|---|
| Trending + Low vol Clean directional grind, low whipsaw | 168,188 | +0.26% | +1.05% | -0.77% | <0.001 | +0.26% | +0.90% | -0.61% | <0.001 | +0.26% | +0.78% | -0.47% | <0.001 |
| Trending + High vol Crisis selloff or parabolic rally | 912,248 | +1.45% | +1.48% | -0.05% | 0.0017 | +1.45% | +1.26% | +0.12% | <0.001 | +1.45% | +1.18% | +0.19% | <0.001 |
| Non-trending + Low vol Quiet chop, summer doldrums | 331,385 | +0.27% | +1.02% | -0.75% | <0.001 | +0.27% | +0.90% | -0.62% | <0.001 | +0.27% | +0.76% | -0.47% | <0.001 |
| Non-trending + High vol Classical "whipsaw zone" for momentum | 1,347,279 | +0.91% | +1.28% | -0.34% | <0.001 | +0.91% | +1.15% | -0.25% | <0.001 | +0.91% | +1.10% | -0.18% | <0.001 |
Sub-period breakdown table (20d alpha)
| Period | N | Alpha % (spx) | p (HAC) | Alpha % (msci) | p (HAC) | Alpha % (spxew) | p (HAC) |
|---|---|---|---|---|---|---|---|
| 2015-2019 2015-01-01 → 2020-01-01 | 824,394 | -0.45% | <0.001 | -0.27% | <0.001 | -0.34% | <0.001 |
| 2020-2022 2020-01-01 → 2023-01-01 | 835,687 | -0.14% | <0.001 | +0.01% | 0.5361 | -0.36% | <0.001 |
| 2023-2026 2023-01-01 → 2099-01-01 | 1,098,355 | -0.38% | <0.001 | -0.31% | <0.001 | +0.26% | <0.001 |
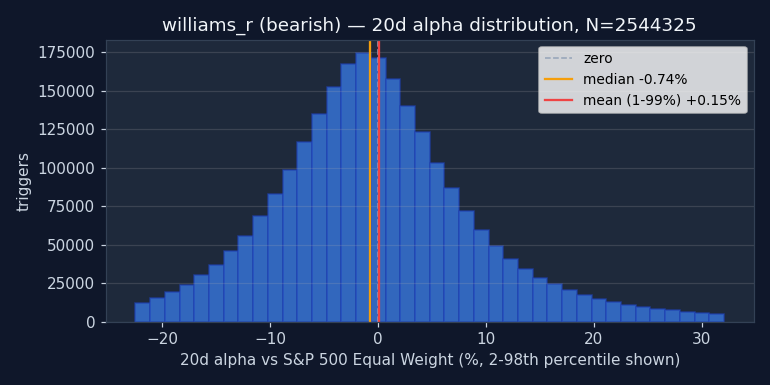
↓ Bearish triggers negative alpha = signal was right (stock underperformed market)
| Bench | Metric | 1d | 5d | 20d | 60d | 252d |
|---|---|---|---|---|---|---|
| spx | Stock % | +0.03% | +0.21% | +0.83% | +2.62% | +12.31% |
| Bench % | +0.02% | +0.23% | +0.92% | +3.02% | +13.74% | |
| Alpha % | +0.00% | -0.01% | -0.05% | -0.39% | -1.46% | |
| Median alpha | -0.06% | -0.29% | -0.97% | -2.60% | -9.87% | |
| Hit rate (α>0) | 48.3% | 46.8% | 45.1% | 42.8% | 38.2% | |
| p (naive) | 0.0037 | 0.0035 | <0.001 | <0.001 | <0.001 | |
| p (HAC) | 0.0038 | 0.0069 | <0.001 | <0.001 | <0.001 | |
| N | 2,682,061 | 2,597,938 | 2,569,361 | 2,516,507 | 2,223,847 | |
| msci | Stock % | +0.03% | +0.21% | +0.83% | +2.62% | +12.31% |
| Bench % | +0.04% | +0.21% | +0.80% | +2.59% | +11.32% | |
| Alpha % | -0.01% | +0.02% | +0.07% | +0.06% | +0.90% | |
| Median alpha | -0.08% | -0.27% | -0.85% | -2.18% | -7.49% | |
| Hit rate (α>0) | 48.0% | 47.1% | 45.7% | 43.9% | 40.8% | |
| p (naive) | <0.001 | <0.001 | <0.001 | <0.001 | <0.001 | |
| p (HAC) | <0.001 | <0.001 | <0.001 | 0.0388 | <0.001 | |
| N | 2,663,410 | 2,579,722 | 2,562,480 | 2,500,319 | 2,213,542 | |
| spxew | Stock % | +0.03% | +0.21% | +0.83% | +2.62% | +12.31% |
| Bench % | +0.04% | +0.22% | +0.74% | +2.26% | +10.00% | |
| Alpha % | -0.02% | +0.00% | +0.15% | +0.40% | +2.40% | |
| Median alpha | -0.07% | -0.26% | -0.73% | -1.78% | -5.87% | |
| Hit rate (α>0) | 48.2% | 47.2% | 46.3% | 45.0% | 42.5% | |
| p (naive) | <0.001 | 0.3638 | <0.001 | <0.001 | <0.001 | |
| p (HAC) | <0.001 | 0.3999 | <0.001 | <0.001 | <0.001 | |
| N | 2,655,513 | 2,557,182 | 2,544,325 | 2,485,306 | 2,196,052 |
Permutation null detail — all horizons × both benchmarks
| Horizon | Bench | Observed lift | Null mean | Null 95% CI | pperm |
|---|---|---|---|---|---|
| 1d | spx | +0.11% | +0.08% | [+0.08%, +0.08%] | 1.000 |
| 1d | msci | +0.13% | +0.09% | [+0.08%, +0.09%] | 1.000 |
| 1d | spxew | +0.11% | +0.07% | [+0.07%, +0.08%] | 1.000 |
| 5d | spx | +0.37% | +0.34% | [+0.33%, +0.34%] | 1.000 |
| 5d | msci | +0.40% | +0.34% | [+0.33%, +0.35%] | 1.000 |
| 5d | spxew | +0.35% | +0.32% | [+0.31%, +0.33%] | 1.000 |
| 20d | spx | +1.13% | +1.08% | [+1.06%, +1.09%] | 1.000 |
| 20d | msci | +1.14% | +1.09% | [+1.08%, +1.10%] | 1.000 |
| 20d | spxew | +1.10% | +1.05% | [+1.03%, +1.06%] | 1.000 |
| 60d | spx | +2.17% | +2.34% | [+2.32%, +2.37%] | 0.005 |
| 60d | msci | +2.19% | +2.36% | [+2.34%, +2.39%] | 0.005 |
| 60d | spxew | +2.20% | +2.27% | [+2.25%, +2.30%] | 0.005 |
| 252d | spx | +4.47% | +4.79% | [+4.73%, +4.84%] | 0.005 |
| 252d | msci | +4.50% | +4.74% | [+4.68%, +4.79%] | 0.005 |
| 252d | spxew | +4.25% | +4.44% | [+4.38%, +4.49%] | 0.005 |
Example triggers on US large-caps (2023+, mcap ≥ $30B)
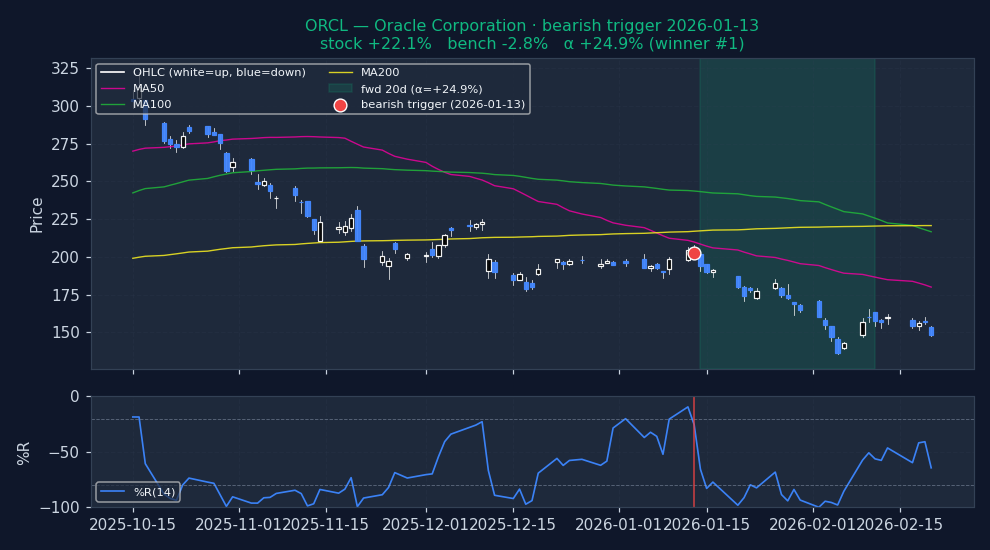
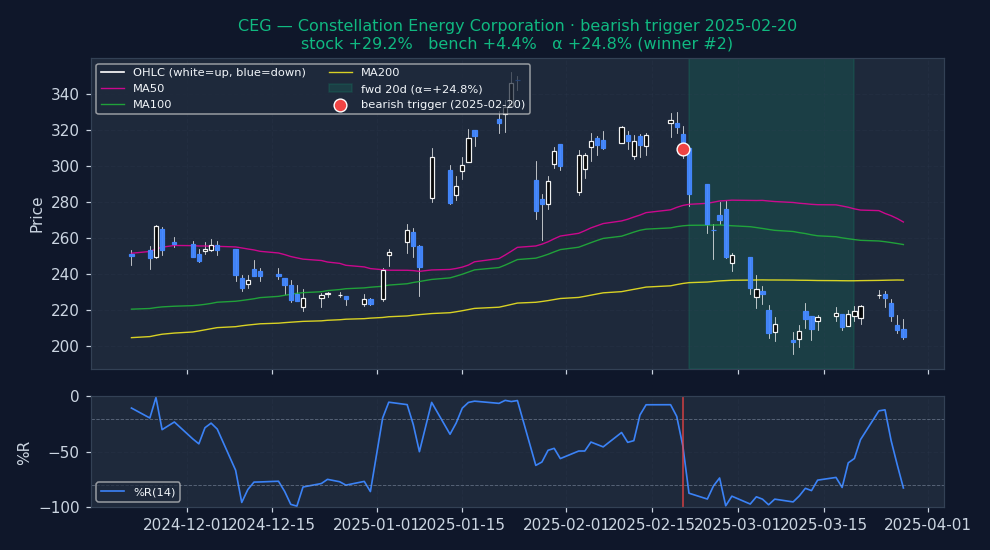
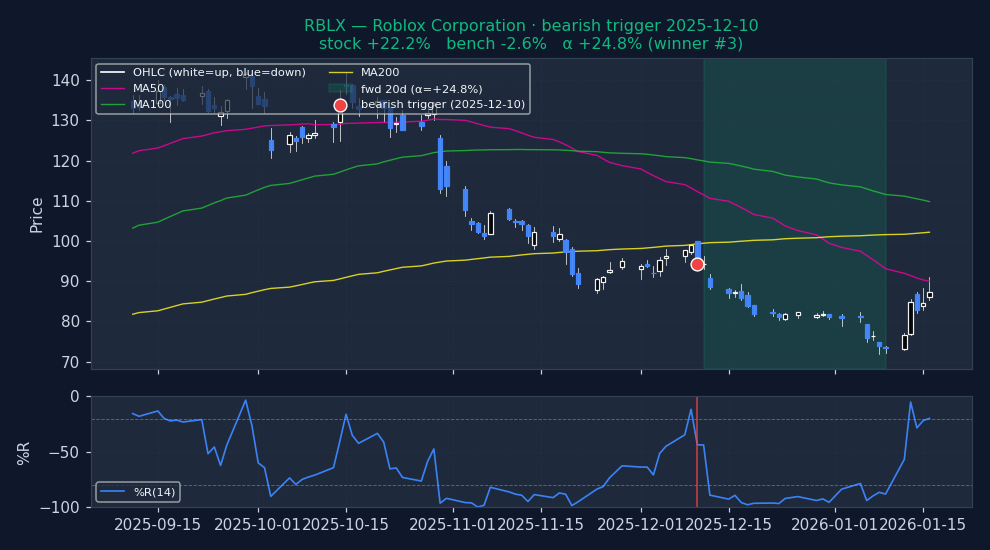
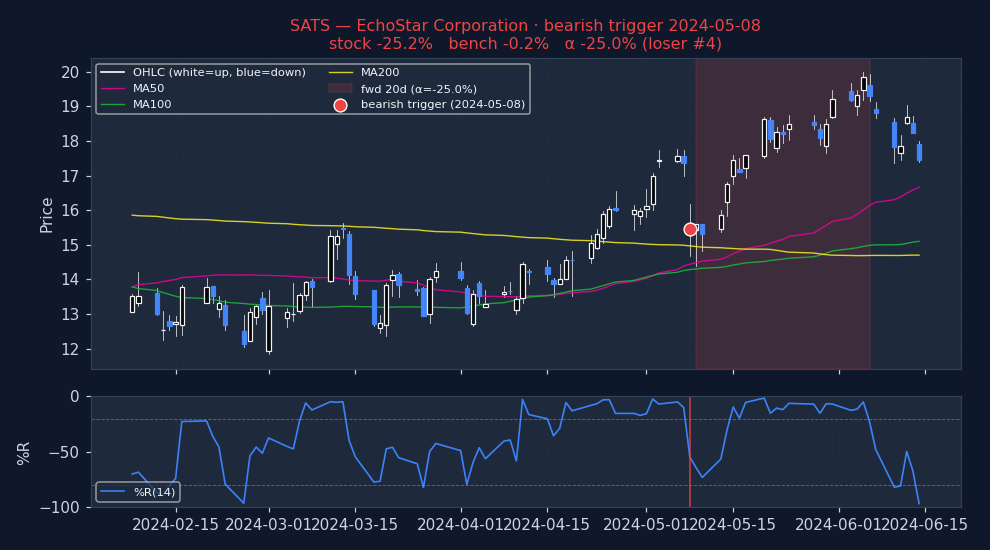
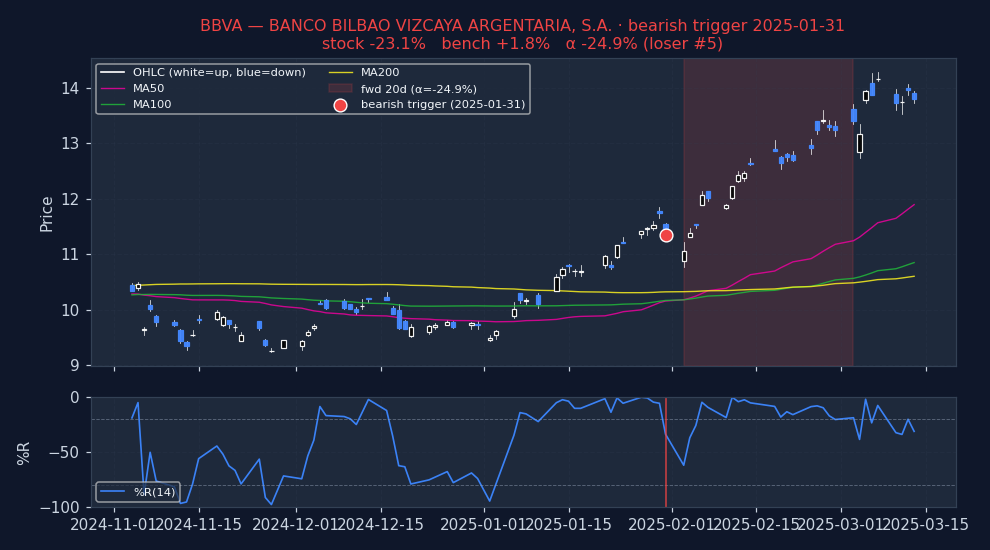
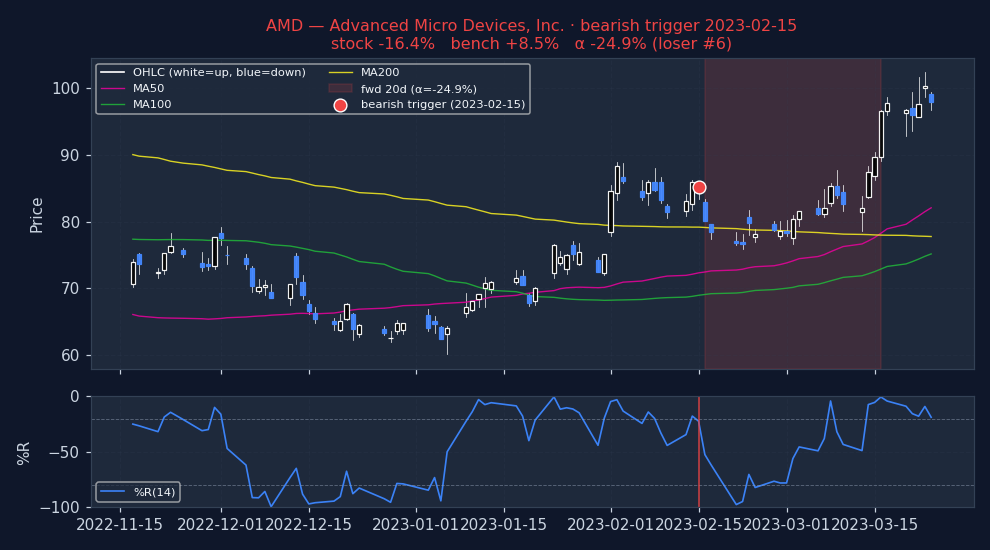
Six recent bearish WILLIAMS_R triggers on US mega-caps. Top three: the signal's best outcomes. Bottom three: the worst. Catalyst-driven outliers (|α| > 25%) excluded so what's left is the signal's own typical good and bad days, not earnings shocks.
Strongest outcomes (what WILLIAMS_R looks like when it works)
Weakest outcomes (what WILLIAMS_R looks like when it fails)
Stock-regime quadrants (2×2 per-stock, 20d alpha detail table)
| Quadrant | N | Stock % (spx) | Bench % (spx) | Alpha % (spx) | p (HAC) | Stock % (msci) | Bench % (msci) | Alpha % (msci) | p (HAC) | Stock % (spxew) | Bench % (spxew) | Alpha % (spxew) | p (HAC) |
|---|---|---|---|---|---|---|---|---|---|---|---|---|---|
| Trending + Low vol Clean directional grind, low whipsaw | 209,277 | +0.45% | +0.69% | -0.22% | <0.001 | +0.45% | +0.54% | -0.06% | 0.0015 | +0.45% | +0.38% | +0.11% | <0.001 |
| Trending + High vol Crisis selloff or parabolic rally | 1,042,153 | +1.01% | +0.97% | +0.08% | <0.001 | +1.01% | +0.84% | +0.23% | <0.001 | +1.01% | +0.76% | +0.32% | <0.001 |
| Non-trending + Low vol Quiet chop, summer doldrums | 337,323 | +0.49% | +0.75% | -0.25% | <0.001 | +0.49% | +0.60% | -0.10% | <0.001 | +0.49% | +0.50% | +0.01% | 0.5731 |
| Non-trending + High vol Classical "whipsaw zone" for momentum | 1,175,111 | +0.89% | +0.97% | -0.05% | 0.0011 | +0.89% | +0.88% | +0.06% | 0.0001 | +0.89% | +0.85% | +0.08% | <0.001 |
Sub-period breakdown table (20d alpha)
| Period | N | Alpha % (spx) | p (HAC) | Alpha % (msci) | p (HAC) | Alpha % (spxew) | p (HAC) |
|---|---|---|---|---|---|---|---|
| 2015-2019 2015-01-01 → 2020-01-01 | 832,308 | -0.48% | <0.001 | -0.28% | <0.001 | -0.25% | <0.001 |
| 2020-2022 2020-01-01 → 2023-01-01 | 822,478 | +0.38% | <0.001 | +0.51% | <0.001 | +0.14% | <0.001 |
| 2023-2026 2023-01-01 → 2099-01-01 | 1,108,442 | -0.04% | 0.0276 | +0.04% | 0.0328 | +0.47% | <0.001 |
Methodology and caveats
How to read. Entry at open of T+1 (one trading day after the signal fires on close of T). 20d = open T+1 to close T+20. Alpha = stock return − benchmark return over the same window (Convention A, single-sided, textbook). For bullish triggers, POSITIVE alpha = signal was right. For bearish triggers, NEGATIVE alpha = signal was right (stock underperformed market). No sign-flipping; the direction of the bet determines what "good" looks like. Per-stock regime is each stock's own ADX(14) and RV(20) at the trigger date — not market-wide state.
Three p-values, three robustness tests. (a) p_naive: scipy one-sample t-test on winsorized alphas. Optimistic because overlapping 20d windows on the same ticker inflate effective N. (b) p_hac: Newey-West HAC with lag = horizon — corrects for the overlap and is the academic-finance standard. (c) p_perm: fraction of 200 random-date null iterations with mean ≥ observed. Tests whether the signal beats random date selection at all. A signal that clears all three (pnaive, phac, pperm all < 0.05) has real information; a signal that fails pperm has zero edge even if the t-test says "significant."
Caveats. (i) Universe reflects today's active tickers; delisted losers pruned → survivorship bias. (ii) Mcap ≥ $100M filter uses today's snapshot, not point-in-time — mild lookahead on which stocks enter the sample, not on returns. (iii) Means and p-values use winsorized alphas (1/99 percentile) to prevent data errors from dominating. Medians and hit rates use raw data. (iv) Zero transaction costs assumed. Realistic bid-ask + commissions remove 20–40bps from 20d alpha on US large-caps, more on small-cap. Sub-20bps alpha is noise in practice. (v) Past performance does not predict future results.
How to use this
1 · When to reach for this signal
Caution recommended. Bullish 20d alpha is -0.33% and worse than random — triggering on random dates would have produced better long-side returns. Bearish 20d alpha is -0.05% and worse than random . Either direction fails the "beats random" test. Don't use Williams %R as a standalone entry trigger. It may still be useful as part of a composite (section 4).
2 · When it works — the setups that drive it
- Best bullish setup: Trending + High vol — alpha -0.05% / 20d on 912,248 historical triggers.
- Best bearish setup: Trending + High vol — alpha +0.08% / 20d on 1,042,153 historical triggers.
- Best era for bullish: 2020-2022 — alpha -0.14% / 20d.
- Best era for bearish: 2020-2022 — alpha +0.38% / 20d.
3 · When it fails — common false positives
- Weakest bullish cell: Trending + Low vol — alpha -0.77% / 20d on 168,188 triggers.
- Weakest bearish cell: Non-trending + Low vol — alpha -0.25% / 20d on 337,323 triggers.
- Worst era for bullish: 2015-2019 — alpha -0.45% / 20d.
- Worst era for bearish: 2015-2019 — alpha -0.48% / 20d.
Signal-specific failure patterns
4 · Pairing inside a screen
The statements below describe how this signal relates to others by construction — which indicator family it belongs to, and where same-family redundancy might reduce the independence of evidence inside a Daily Report. These are taxonomic classifications drawn from standard technical-analysis texts; they are not pairing backtests. A multi-signal convergence backtest is planned but not yet run.
Oscillator-family redundancy
Williams %R belongs to the momentum-oscillator family alongside RSI, Stochastics, and CCI — each is constructed from closing price over a short lookback, normalised to a bounded range (Murphy, Technical Analysis of the Financial Markets, 1999; Pring, Technical Analysis Explained, 5th ed. 2014; Kirkpatrick & Dahlquist, Technical Analysis, 3rd ed. 2015). Stacking two or more of these in the same direction within a single Daily Report produces correlated rather than independent evidence.
What would likely rescue this signal
This block calls out the data or conditions that could turn a technically weak signal into a usable one in a composite screen. Based on signal mechanics and the observed failure patterns above; individual combinations are not yet backtested.
- Pair with trend filter — Williams bearish alone has edge; Williams bearish + close below 50DMA (downtrend filter) would likely concentrate the alpha. Testable without new data.
- Extend holds — 60d alpha is nearly 3x the 20d alpha. Holding the full signal window captures substantially more. Time stops > price stops.
See also Why technical-only signals don't survive on their own for the broader argument.
5 · Before you act — a 5-point checklist
- Normal trading day? Rule out earnings (within ±3 days), ex-dividend, or known corporate-action dates — the signal is almost certainly reading noise, not momentum, in those windows.
- Where is price vs its own 50 / 200 DMA? A mean-reversion signal firing against the long-term trend (e.g. oversold in a clean uptrend) is much more reliable than one firing with it.
- What's the sector breadth doing? An isolated signal in a broadly down-trending sector is a lower-confidence setup than one firing with the rest of its peer group.
- Is ADV20 enough for your size? If the trigger is on a $500M name and you want to move $1M notional, you're the tape. Consider adv20d ≥ 5% of your intended position.
- What invalidates you? Define a price level (for longs: a close below the trigger-day low; for shorts: close above the trigger-day high) and honor it. The backtest alpha is an average; any one trade can be at either tail.
Execution notes
Bearish is the tradable side. 449k triggers over 2015-2026 — very large dataset. Alpha compounds from 20d to 60d (−0.22 → −0.58). Entry open T+1. Bullish Williams %R has not produced positive alpha in any horizon, any regime, any sub-period — skip.