How Chartlas Replaces Three Bloomberg Functions in a Single Workflow
If you use Bloomberg, you know the drill. Screen stocks in EQS, check technical signals in TSIG, scan for chart patterns in ATPR — and somehow tie all of that together manually. Each function is powerful on its own, but there is no single pipeline that screens a universe, computes signals, and delivers results to you automatically.
That is exactly why I built Chartlas. As a long-time Bloomberg user and research analyst, I kept rebuilding the same workflow in R scripts: screen, signal detection, alerting. Chartlas puts that entire pipeline into one tool, runs it daily, and delivers the output to your inbox — as a consolidated email report, downloadable Excel spreadsheet, or PDF.
Here is how the three Bloomberg functions compare to what Chartlas does in a single action.
Bloomberg EQS — Equity Screening
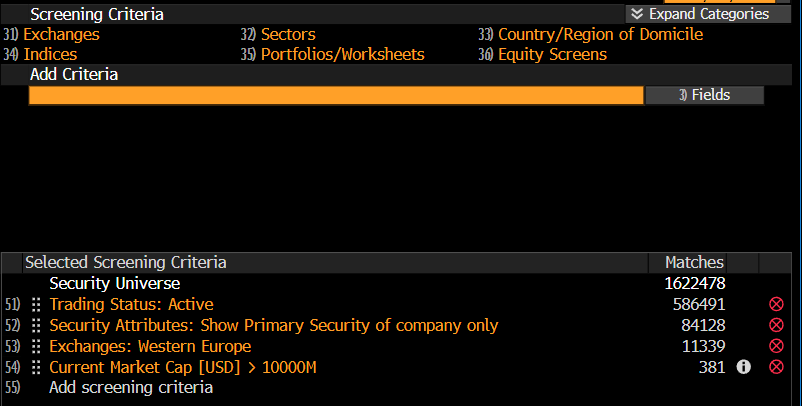
What it does: EQS lets you filter the global equity universe by fundamentals, geography, sector, market cap, and a wide range of other criteria. You can save screens, rank results, and export to Excel. It also supports historical screening with "As Of" dates going back to 1992.
What it does not do: EQS is a filter — it tells you which stocks match your criteria right now. It does not monitor those stocks for technical signal changes over time. You run the screen, get results, and close the function. Tomorrow you run it again.
Chartlas equivalent: When you create a report in Chartlas, you define your universe by geography, exchange, sector, and market cap. Comprehensive fundamental filtering (P/E, EPS growth, analyst estimates) is on the roadmap but not yet available — for now, the universe definition is simpler than EQS. Update (July 2026): this shipped — the Fundamentals filter went live on July 6, 2026, with ~28 metrics (P/E, EPS growth, margins, analyst upside, and more) filterable in every report. But the key difference is what happens after: once created, the report runs automatically every day after each exchange closes. You do not re-run it manually. And the output is not just a list of stocks that match filters — it is a list of stocks where something actually happened: a signal triggered.
Bloomberg TSIG — Trading Signals
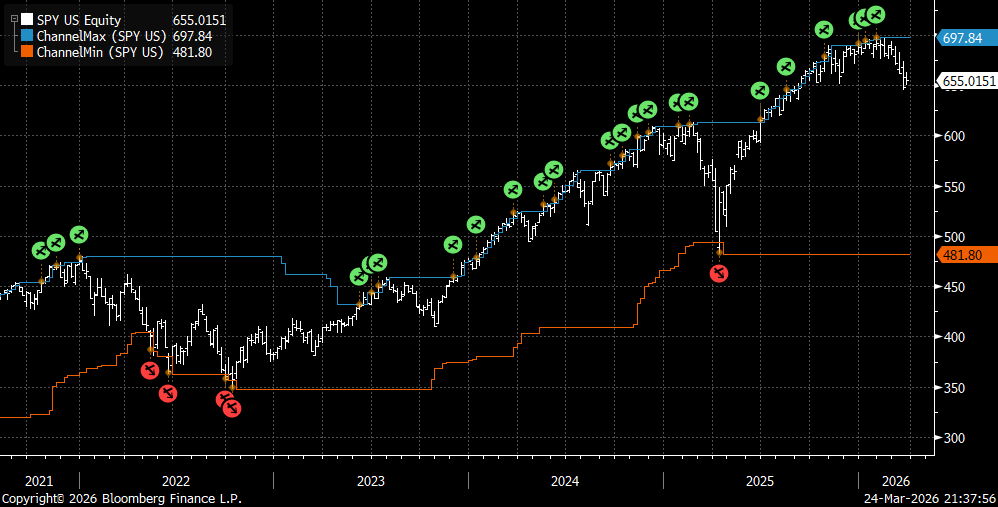
What it does: TSIG lets you create and monitor trading signals — RSI, MACD, moving average crossovers, unusual streaks, and more. You can view active signals on a chart using the GP function, build scoring models in STDY, and backtest strategies in BT. Through BQL (Bloomberg Query Language), you can pull TSIG data into Excel and filter signals across a universe.
What it does not do: TSIG is built around individual securities and signal definitions — it offers alerts and sample-signal scanning, but the core workflow analyzes one stock's signals at a time. To scan a large universe — say, all European equities — for MACD crossovers, you need to combine TSIG with BQL in Excel, which requires scripting knowledge and significant setup time. There is no built-in "scan 34,000 stocks for all active signals and show me the results."
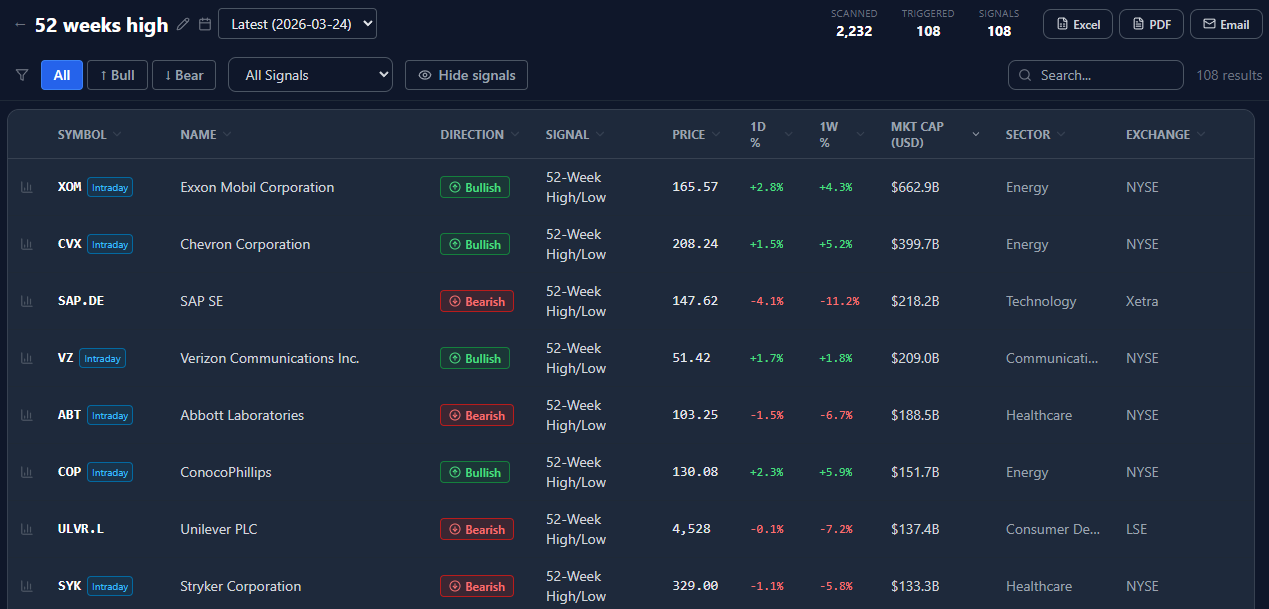
Chartlas equivalent: Chartlas computes 21 technical signals across the entire universe every day, automatically. Golden Cross, Death Cross, MACD Bullish/Bearish, Bollinger Band breakouts, RSI extremes, volume surges, 20-day and 52-week highs/lows, higher-highs/higher-lows streaks — all computed for 34,000+ securities on 70+ exchanges. No BQL scripting needed. No per-ticker setup. Results land in your email, ready to download as Excel or PDF. And every ticker comes with an interactive signal chart — giving you easy access to charts across the entire universe without opening each one individually.
Bloomberg ATPR — Automated Technical Pattern Recognition
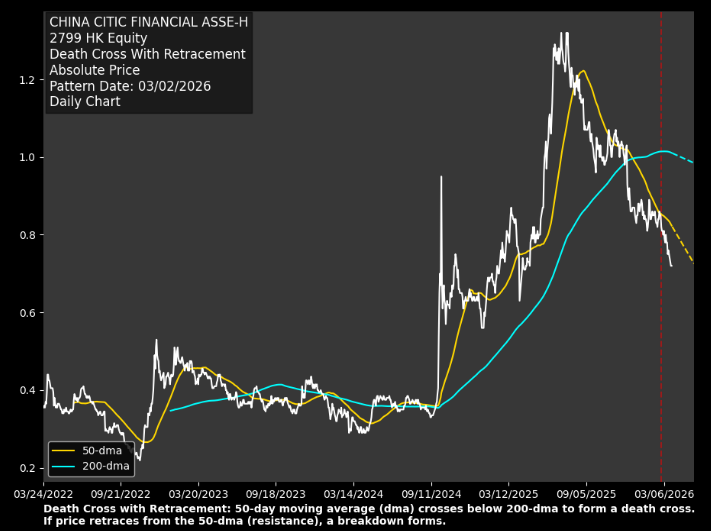
What it does: ATPR is Bloomberg Intelligence's algorithm that screens tens of thousands of securities daily for chart breakout patterns — head-and-shoulders, triangles, pennants, gap fills, new highs/lows, and 18 patterns in total. You can screen your portfolio for active patterns and set alerts.
What it does not do: ATPR runs on Bloomberg's schedule and output format. You cannot easily combine ATPR results with your own screening criteria, export a bulk report for offline review, or share the output with colleagues who do not have a Terminal. If you want to distribute ATPR findings to your team, you are copying and pasting.
Chartlas equivalent: Chartlas's signal engine covers trend breakdowns, momentum signals, and volatility breakouts. While it does not do visual chart pattern recognition (head-and-shoulders, triangles), it catches the same underlying price dynamics through signals like Bullish Trend Breakdown & Bearish Trend Breakout, Higher-Highs & Higher-Lows Streak, 52-Week New High/Low, and 20-Day New High/Low. Update (July 2026): Chartlas now ships a pattern-recognition signal family — double top/bottom breakouts and failed double top/bottom (trapped bulls/bears) detection — though head-and-shoulders and triangles remain out of scope. Every result can be downloaded as an Excel spreadsheet or PDF report — easy to save, study offline, or share with colleagues without needing a Terminal.
The Workflow Problem
On Bloomberg, the typical workflow looks like this:
- EQS — Screen for stocks matching your fundamental/geographic criteria
- TSIG — Check each stock individually for active technical signals
- ATPR — Scan for chart patterns across your portfolio
- Excel/BQL — Try to combine everything programmatically
- Manual review — Repeat daily
Each step is a separate function. There is no "run EQS, compute all TSIG signals on the results, check ATPR patterns, and email me the output." You are the integration layer.
Chartlas collapses this into one action:
- Create a report (define universe + select signals) — takes 60 seconds
- Receive daily reports automatically — via email, with Excel and PDF downloads available
What Chartlas Adds Beyond Bloomberg
Daily email delivery. Bloomberg does not send you a scheduled email digest of screening results — alerts exist, but to review EQS output you are back at the Terminal. Chartlas sends a formatted report to your inbox every day — with ticker, signal, direction, price, and market cap. Open your email, scan the table, click into anything interesting.
Excel and PDF exports. Every report result can be downloaded as an Excel spreadsheet or a PDF report. Save them locally, study them offline, or share with colleagues who do not have access to Chartlas. Bloomberg's EQS can export to Excel, but TSIG and ATPR results require manual work to get into a shareable format.
4,000+ CHRT Industry Indexes. Equal-weighted industry indexes across 8 geographies — with Investable and Liquid variants — let you see which parts of the market are moving before drilling into individual names. Bloomberg has deep index coverage, but not a built-in equal-weighted industry-index layer integrated with your screening workflow at this granularity.
Upload your own ticker list. If you already have a watchlist — from Bloomberg, a broker, or any other source — you can paste it directly into Chartlas. Bloomberg format (AAPL US Equity, 7203 JP Equity, MC FP Equity) is fully supported. The parser converts them automatically.
No Terminal required. Chartlas runs in any browser. Anyone on your team can access daily technical signal screening across global markets — no special software or hardware needed.
Quick Comparison
| Bloomberg (EQS + TSIG + ATPR) | Chartlas | |
|---|---|---|
| Universe screening | EQS — comprehensive fundamentals, manual | Geo/sector/market cap + ~28 fundamental metrics |
| Signal computation | TSIG — per-ticker, needs BQL for batch | 21 signals, 34K+ tickers, automatic |
| Pattern detection | ATPR — 18 patterns, daily update | Double top/bottom, failed patterns + trend/momentum signals, daily per-exchange |
| Email delivery | Alerts only; no consolidated digest | Consolidated daily report included |
| Excel/PDF export | EQS to Excel only | Full Excel + PDF for any report |
| Custom indexes | Broad index coverage | 4,000+ equal-weighted CHRT indexes (Investable/Liquid variants) |
| Ticker upload | N/A (you are already on Terminal) | Bloomberg, Yahoo, TradingView, CSV formats |
| Setup time | Hours (EQS + TSIG + BQL + ATPR) | 60 seconds |
| Access | Terminal subscription required | Browser-based, no special software |
Who This Is For
Chartlas does not replace Bloomberg. Bloomberg's depth in fundamentals, fixed income, news, and analytics is unmatched. But if your daily routine includes screening equities for technical signals and you are tired of manually stitching together EQS, TSIG, and ATPR — Chartlas does that specific job faster, automatically, and — during our beta — for free.
It is especially useful if you want to:
- Monitor a large universe daily without re-running screens manually
- Get signal alerts delivered to your email
- Download and share results as Excel or PDF reports with your team
- See industry-level market dynamics through equal-weighted CHRT indexes
- Upload your existing Bloomberg watchlist and start monitoring immediately