New Bullish and Bearish Pattern Signals: Double Top Breakout, Double Bottom Breakdown, and Failed Reversals
Finding bullish breakouts before they run — or spotting bearish breakdowns before the drop accelerates — is what every trader wants. The challenge is doing it across thousands of stocks without spending hours on charts.
Chartlas now detects four chart pattern signals automatically across 34,000+ securities on 70+ global exchanges, as part of the platform's 21 technical signals (counts verified July 2026). These patterns fire in your daily report just like any other signal — no manual chart scanning needed.
The Four New Signals
Double Top Breakout — Bullish
A stock hits the same resistance level twice, pulls back each time, then finally breaks through. Two failed attempts to push past a ceiling, followed by a decisive move higher — that is a bullish signal. Resistance is broken, and buyers are in control.
Once a resistance level that held twice is finally cleared, it tends to become support. For how these triggers have actually performed, see the live backtest on the signal's docs page.
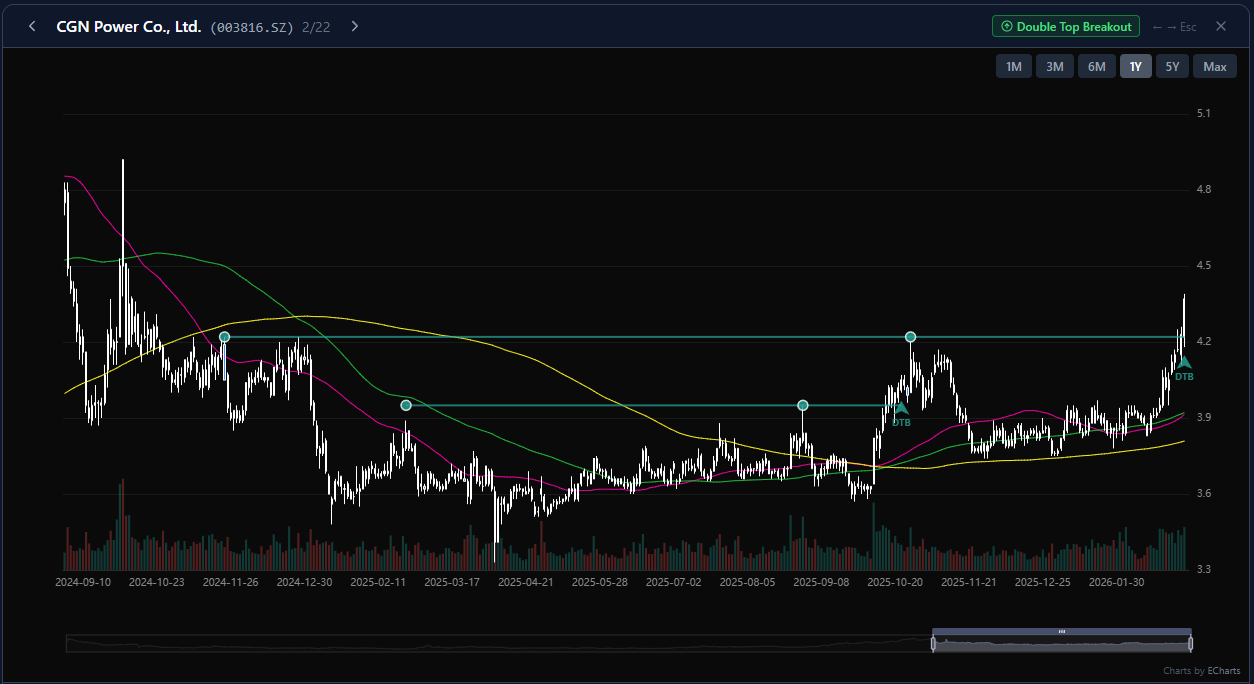 CGN Power double top breakout on March 11, 2026
Double Bottom Breakdown — Bearish
The mirror image. A stock bounces off the same support level twice, then breaks below it. The floor that held twice has cracked — a bearish signal that sellers have taken over.
Double bottom breakdowns can accelerate after the break, as stop-losses trigger and longs capitulate. Historical trigger stats are on the signal's docs page.
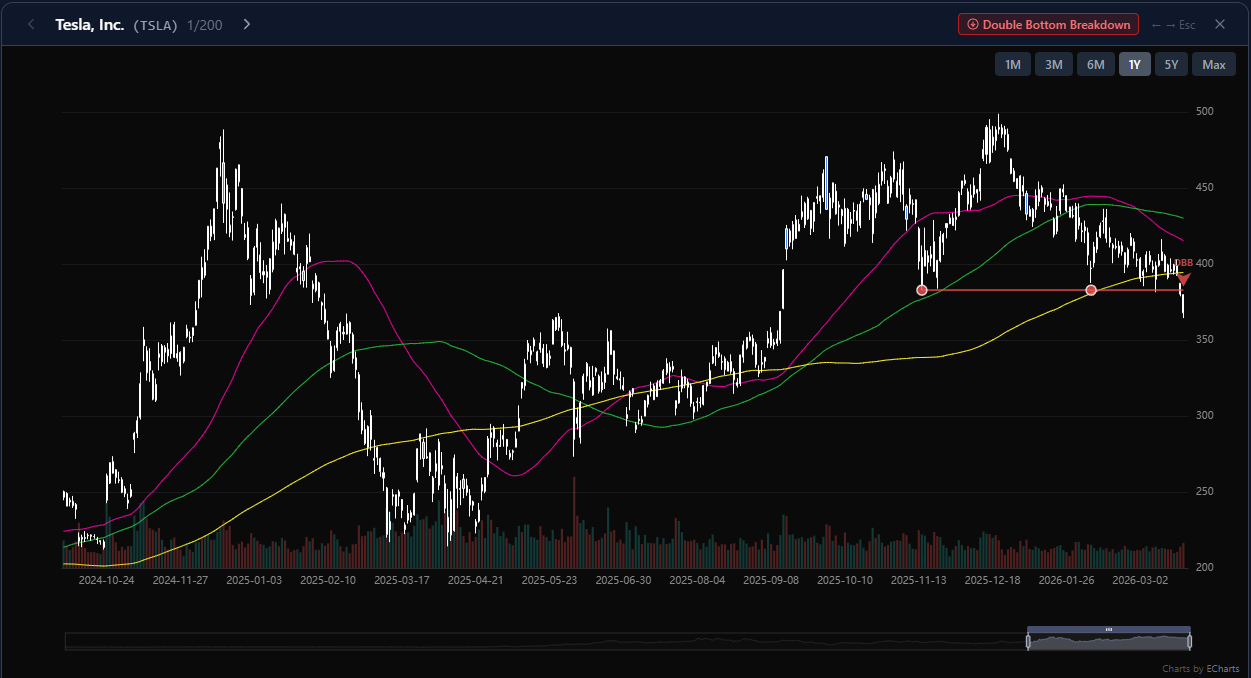 Tesla double bottom breakdown on March 20, 2026
Failed Double Top Breakout — Bearish Reversal
This one catches the trap. A bullish Double Top Breakout fires — price breaks above resistance. But then the move fails. Price falls back below the broken level. Traders who bought the breakout are stuck in a losing position.
The mechanism is straightforward: the initial breakout attracted buyers, and when the move could not hold, trapped bulls become forced sellers on the way out. If you see a Failed Double Top Breakout after a recent bullish breakout, it is a warning that the upside move was a false signal — the live backtest is on the signal's docs page.
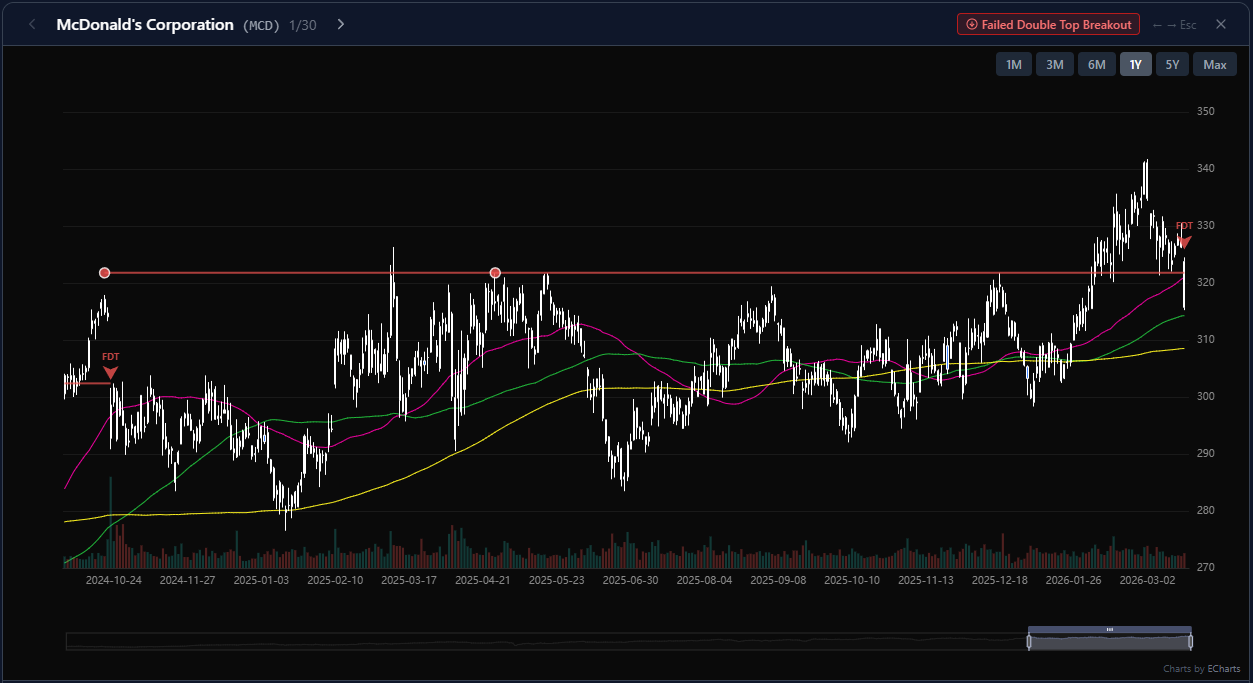 McDonald's failed double top breakout on March 18, 2026
Failed Double Bottom Breakdown — Bullish Reversal
The opposite trap. A bearish Double Bottom Breakdown fires — price drops below support. But then the move reverses. Price climbs back above the broken level. Shorts who sold the breakdown are now squeezed.
This is a bullish reversal signal. The market tested the downside, rejected it, and reversed higher. A failed breakdown can squeeze shorts as they cover, with new buyers stepping in behind them — historical performance is on the signal's docs page.
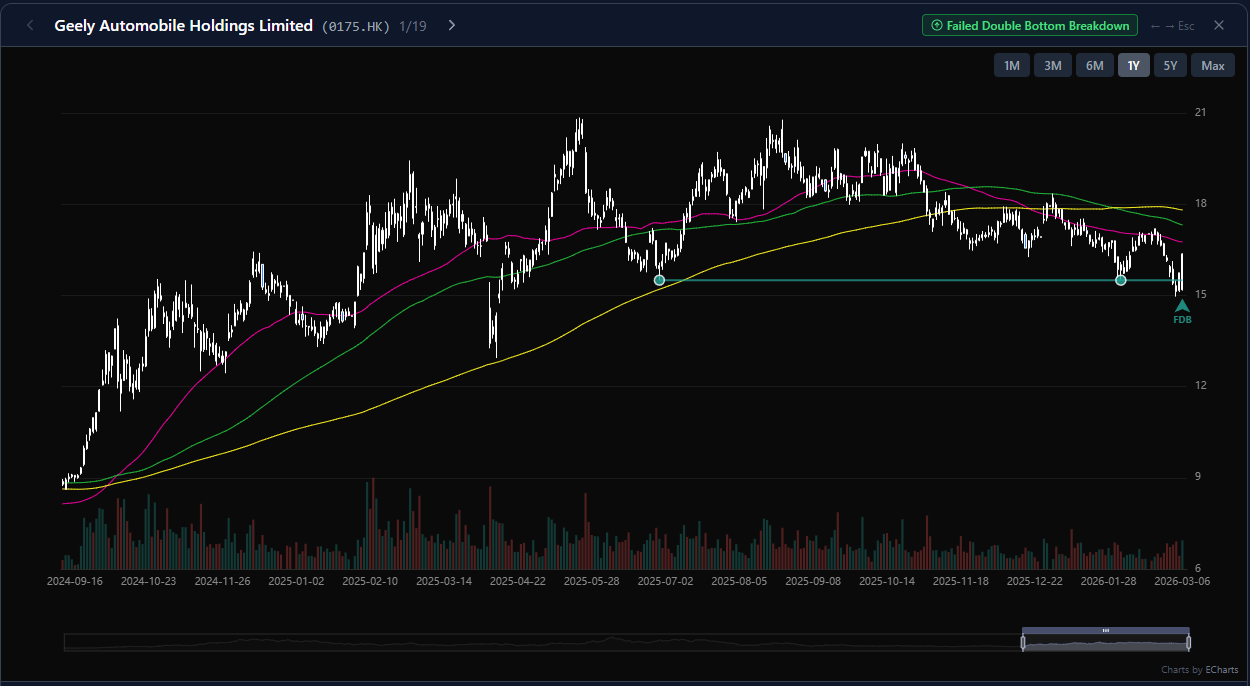 Geely failed double bottom breakdown on March 6, 2026
How the Four Signals Work Together
These signals tell a complete story about where a stock sits in its price structure:
| Signal | Direction | What It Means |
|---|---|---|
| Double Top Breakout | Bullish | Resistance broken — new uptrend starting |
| Double Bottom Breakdown | Bearish | Support broken — new downtrend starting |
| Failed Double Top Breakout | Bearish reversal | Breakout was a trap — selling likely |
| Failed Double Bottom Breakdown | Bullish reversal | Breakdown was a trap — buying opportunity |
The key insight: when a breakout or breakdown fires, watch for the failed pattern in the following weeks. If it appears, the original signal was a false move — and the stock is likely heading in the opposite direction.
Why This Matters for Your Portfolio
Catching bullish setups early. A Double Top Breakout on a stock you were not watching could be the start of a multi-month uptrend. Chartlas surfaces these automatically — you do not need to manually scan charts to find them.
Avoiding bearish traps. A Failed Double Top Breakout warns you that what looked like a bullish breakout is actually reversing. If you bought the breakout, this is your signal to reconsider. If you are looking for short candidates, this is confirmation.
Spotting bearish breakdowns. A Double Bottom Breakdown on a stock in your portfolio is an early warning that support has failed. You see it in your email before the market opens.
Finding bullish reversals. A Failed Double Bottom Breakdown means the bears could not follow through — the stock bounced back above support. This is a classic trap setup, and Chartlas detects it across the entire market daily.
How It Shows Up in Your Workflow
All four signals work exactly like every other signal in Chartlas:
- Daily email reports — pattern signals appear alongside your other triggered signals with ticker, direction (bullish or bearish), and price
- Interactive charts — each signal is marked with level lines showing the resistance or support that was tested, circles at the two reference peaks or troughs, and a breakout arrow
- Excel and PDF exports — download the full report for offline analysis or share with your team
- Market breadth — two new breadth indicators track how many stocks are breaking out vs breaking down, and how many of those moves are failing across the market
Getting Started
Chartlas now offers 21 technical signals — including these four new pattern signals — across 34,000+ securities on 70+ global exchanges. Create a report, pick your signals, and get daily emails with every bullish breakout and bearish breakdown that fires across your universe.