turnaround_cross
Turnaround Cross
A stock that has fallen a long way finally turns up. The short-term trend crosses above the long-term trend while the stock is still far below its multi-year peak, and the turn arrives with real momentum rather than a drift. Ordinary trend crossovers fire on anything resuming an uptrend; this one only fires on a recovery from a deep decline, so it is rare.
Signal family
Trend — Signals that fire when price is continuing or reversing an established directional move. Momentum-following by nature.
Parameters
| Name | Description | Default | Range |
|---|---|---|---|
| depth_ratio | Depth: SMA200 at most this share of its 3y peak | 0.7 | 0.3–0.95 |
| thrust_pct | Thrust: SMA50 rise over the window | 0.12 | 0.02–0.4 |
| thrust_window | Thrust window (days) | 20 | 5–60 |
Historical context
13,491 triggers on 8,769 tickers, 2001-02-13 → 2026-09-07. Universe: global — all covered exchanges (mcap ≥ $100,000,000, price ≥ $1). Long-only convention: BUY at open T+1, hold the horizon, compare to S&P 500 Equal Weight over the same window.
Methodology footnotes
Benchmarks shown in the detail tables: spxew (S&P 500 Equal Weight — primary, median-stock view, avoids the 2020+ megacap-concentration distortion), spx (S&P 500 cap-weighted, distorted post-2020), msci (MSCI World USD). Per-stock regime tags: trending = ADX(14) ≥ 25, high vol = 20d realized annualized vol ≥ 20%. 1d return = intraday T+1 open→close; 20d = open T+1 to close T+20.
At a glance — alpha vs S&P 500 Equal Weight, global universe
Holding-period sensitivity. Bullish columns: positive = signal worked (long the trigger beat the index). Bearish columns: negative = signal worked (the flagged stock underperformed).
| Horizon | Bullish α |
|---|---|
| 5-day | -0.02% |
| 20-day | +0.55% |
| 60-day | +1.41% |
| 1-year | +19.22% |
Turnaround Cross is a single-direction signal — only the bullish side is meaningful.
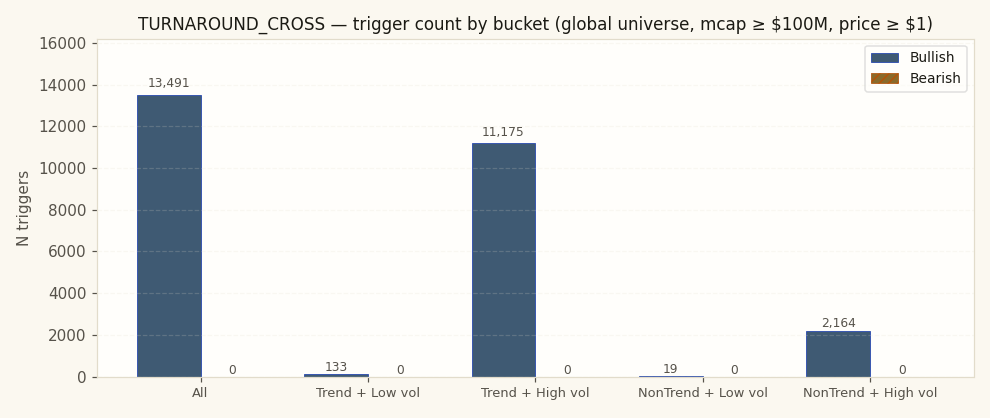
Where does TURNAROUND_CROSS actually fire?
The bucket distribution often reveals what the signal really is, regardless of its textbook label. Heavy concentration in "non-trending + high vol" = it's mostly a chop-market event. Heavy in "trending + low vol" = it picks up the smooth grinds. Read the chart before the alpha numbers — context shapes everything that follows.
Does it work in every regime?
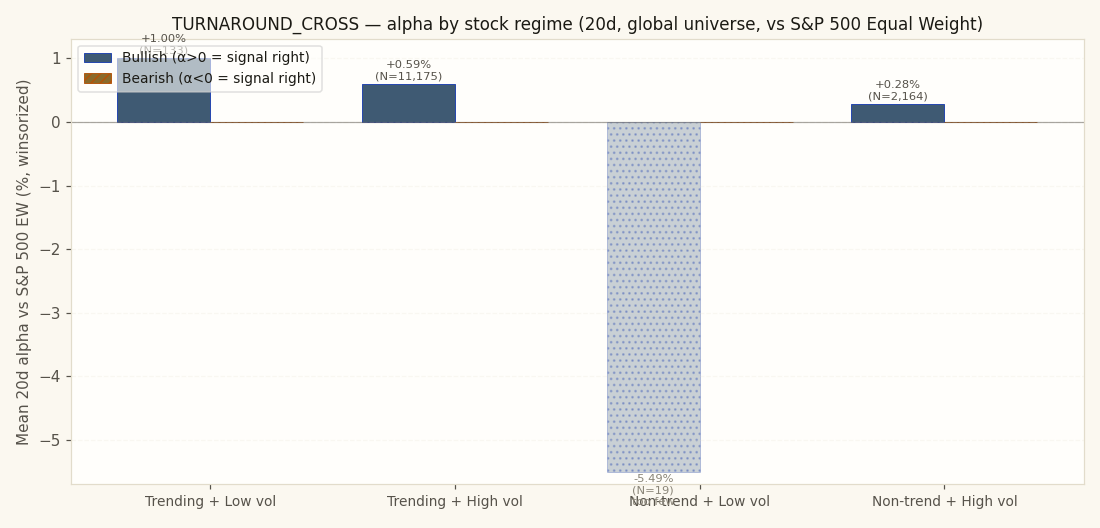
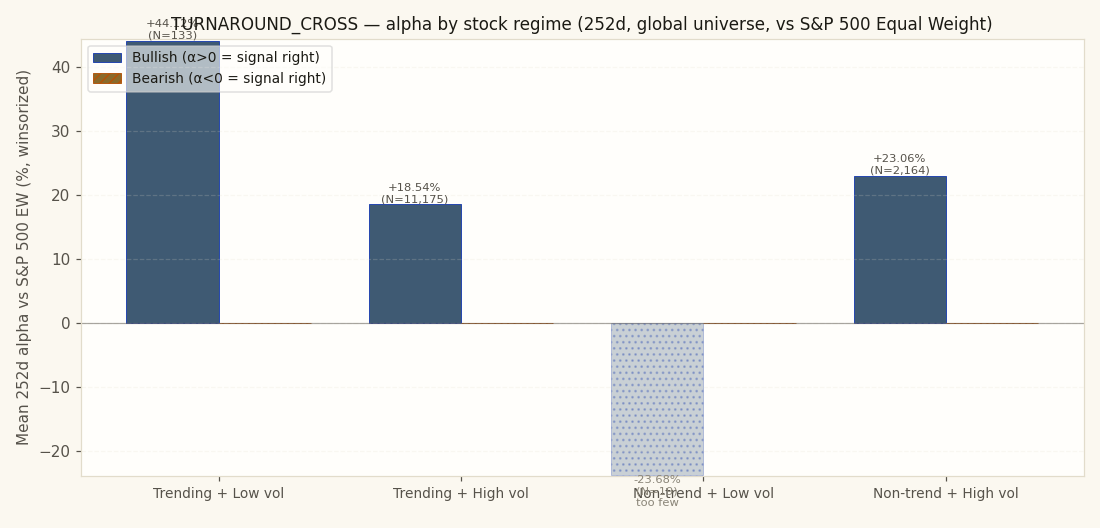
Trigger alpha split by the host stock's own regime on the trigger date — trending or ranging, high-vol or low-vol. This is the 20-day alpha a trade taken on the trigger would have captured. This signal is bullish-only, so positive bars mark the regimes where it worked and negative bars mark regimes to avoid. One strong bar beside three flat ones is not a "20-day alpha" signal — it is a "20-day alpha when the stock is X" signal. Bar labels carry the sample size; a cell built on a handful of triggers is noise, not a regime finding.
Does it work in every era?
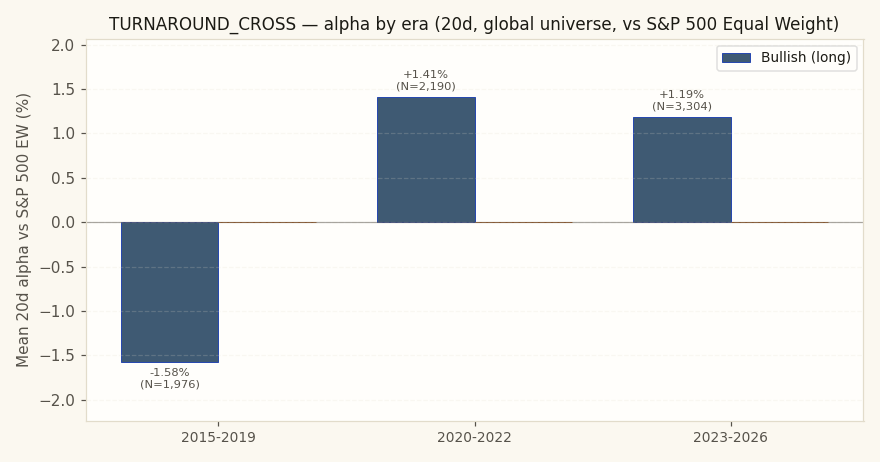
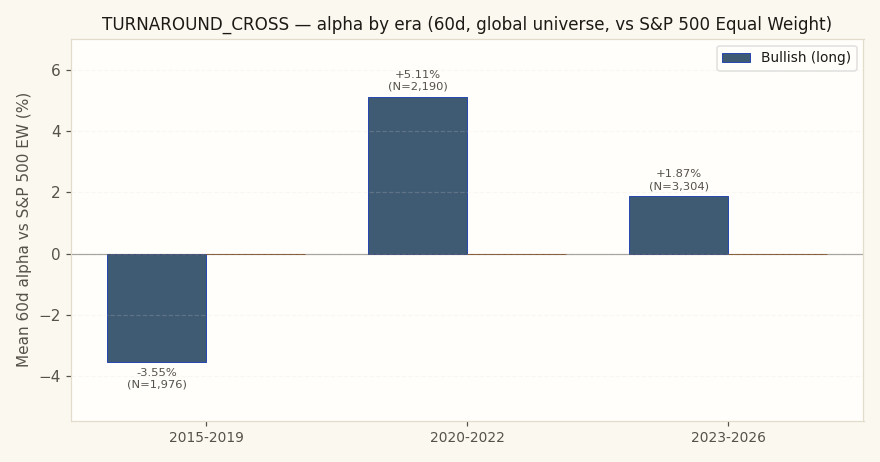
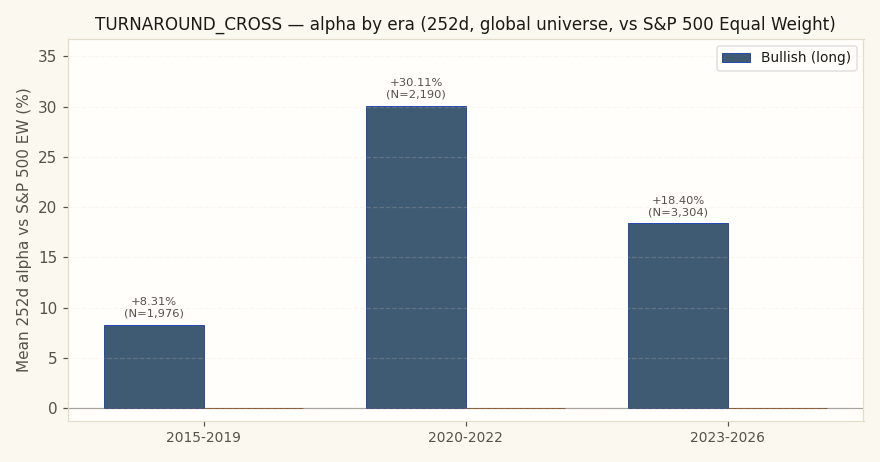
A multi-year average can hide major instability. The sample splits into three windows: 2015–2019 (pre-COVID), 2020–2022 (pandemic + 2022 bear), and 2023+ (post-ZIRP + AI megacap rally). All three carrying the sign that favours the trade means the signal is durable; one era doing all the work means a regime-specific edge that may not repeat. The greater the variance across eras, the smaller the position it justifies. Long-history signal: requires 956 trading days of prior data per ticker. The earliest era may show fewer triggers as a result.
Longer-horizon views
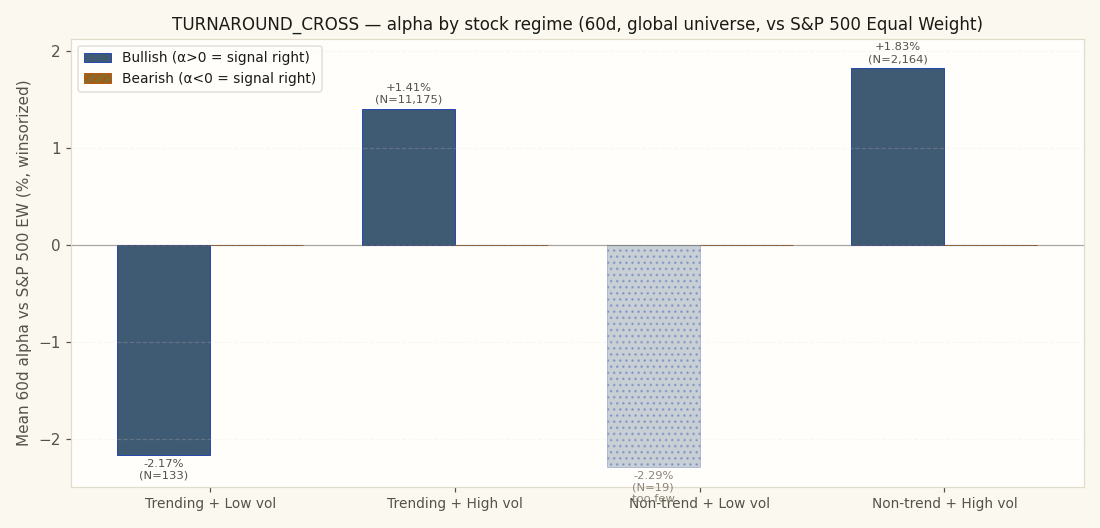
This signal carries a long lookback window (956 trading days of prior history required per ticker), suggesting it's designed to catch moves that play out over months, not days. The charts below repeat the quadrant and sub-period analyses at the 60-day and 1-year (252-day) horizons, showing how the signal's relationship with the benchmark evolves with holding period.
60-day alpha by stock regime
60-day alpha by era
1-year alpha by stock regime
1-year alpha by era
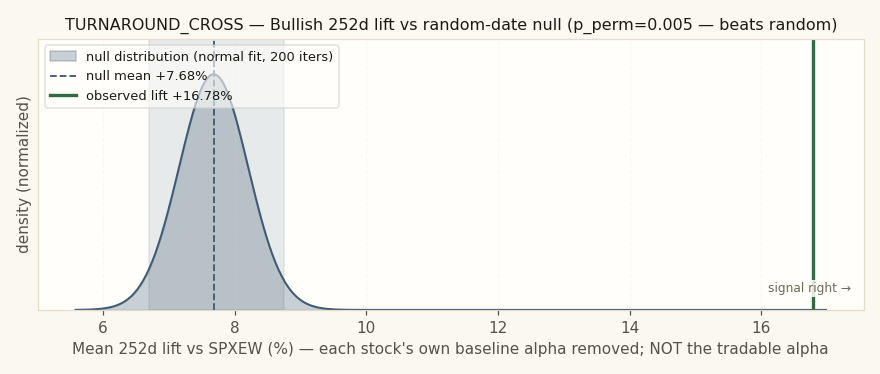
1-year observed lift vs random-date null — bullish side
↑ Bullish triggers
| Bench | Metric | 1d | 5d | 20d | 60d | 252d |
|---|---|---|---|---|---|---|
| spxew | Stock % | -0.03% | +0.25% | +1.21% | +6.90% | +34.08% |
| Bench % | +0.05% | +0.23% | +0.88% | +2.40% | +13.54% | |
| Alpha % | -0.14% | -0.02% | +0.55% | +1.41% | +19.22% | |
| Median alpha | -0.27% | -0.64% | -1.99% | -4.81% | -4.17% | |
| Hit rate (α>0) | 45.7% | 45.9% | 43.8% | 41.8% | 46.7% | |
| p (naive) | 0.0044 | 0.8581 | 0.0199 | 0.0005 | <0.001 | |
| p (HAC) | 0.0058 | 0.8738 | 0.0922 | 0.0837 | <0.001 | |
| N | 7,228 | 7,001 | 6,939 | 6,864 | 6,444 | |
| spx | Stock % | -0.03% | +0.25% | +1.21% | +6.90% | +34.08% |
| Bench % | +0.03% | +0.34% | +1.34% | +3.45% | +17.26% | |
| Alpha % | -0.11% | -0.12% | -0.02% | +0.28% | +15.07% | |
| Median alpha | -0.24% | -0.72% | -2.53% | -5.84% | -8.92% | |
| Hit rate (α>0) | 46.0% | 45.4% | 42.4% | 40.3% | 43.4% | |
| p (naive) | 0.0213 | 0.3143 | 0.9427 | 0.4958 | <0.001 | |
| p (HAC) | 0.0248 | 0.3716 | 0.9585 | 0.7521 | 0.0009 | |
| N | 7,277 | 7,080 | 7,026 | 6,923 | 6,503 | |
| msci | Stock % | -0.03% | +0.25% | +1.21% | +6.90% | +34.08% |
| Bench % | +0.05% | +0.30% | +1.16% | +3.03% | +15.19% | |
| Alpha % | -0.12% | -0.08% | +0.17% | +0.73% | +17.14% | |
| Median alpha | -0.27% | -0.72% | -2.35% | -5.53% | -6.90% | |
| Hit rate (α>0) | 45.9% | 45.6% | 42.9% | 41.0% | 44.8% | |
| p (naive) | 0.0077 | 0.4760 | 0.4519 | 0.0692 | <0.001 | |
| p (HAC) | 0.0094 | 0.5216 | 0.5808 | 0.3940 | <0.001 | |
| N | 7,294 | 7,102 | 7,048 | 6,944 | 6,523 |
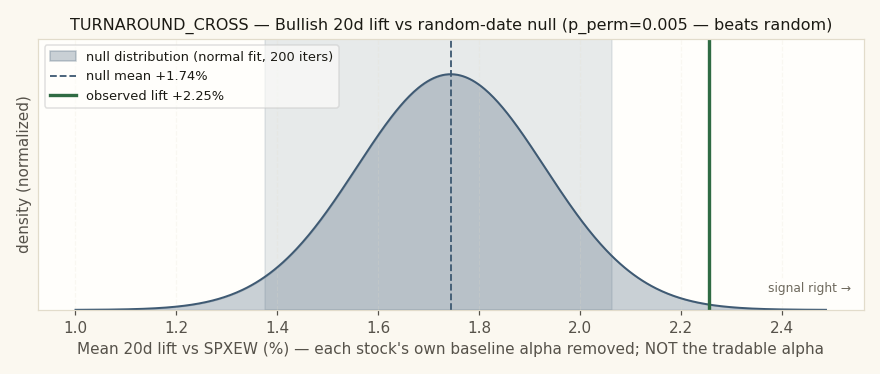
Permutation null detail — all horizons × each benchmark
| Horizon | Bench | Observed lift | Null mean | Null 95% CI | pperm |
|---|---|---|---|---|---|
| 1d | spxew | +0.05% | +0.11% | [+0.03%, +0.18%] | 0.950 |
| 1d | spx | +0.05% | +0.12% | [+0.04%, +0.20%] | 0.950 |
| 1d | msci | +0.06% | +0.12% | [+0.04%, +0.19%] | 0.930 |
| 5d | spxew | +0.63% | +0.53% | [+0.36%, +0.73%] | 0.169 |
| 5d | spx | +0.56% | +0.54% | [+0.37%, +0.75%] | 0.393 |
| 5d | msci | +0.59% | +0.55% | [+0.38%, +0.75%] | 0.313 |
| 20d | spxew | +2.25% | +1.74% | [+1.38%, +2.06%] | 0.005 |
| 20d | spx | +1.90% | +1.76% | [+1.41%, +2.06%] | 0.299 |
| 20d | msci | +1.96% | +1.78% | [+1.43%, +2.09%] | 0.199 |
| 60d | spxew | +4.90% | +3.99% | [+3.42%, +4.59%] | 0.005 |
| 60d | spx | +4.46% | +4.03% | [+3.51%, +4.61%] | 0.090 |
| 60d | msci | +4.39% | +4.05% | [+3.47%, +4.60%] | 0.124 |
| 252d | spxew | +16.78% | +7.68% | [+6.69%, +8.75%] | 0.005 |
| 252d | spx | +16.31% | +7.94% | [+6.98%, +9.06%] | 0.005 |
| 252d | msci | +15.66% | +7.78% | [+6.87%, +8.80%] | 0.005 |
Example triggers on US large-caps (2023+, mcap ≥ $30B)
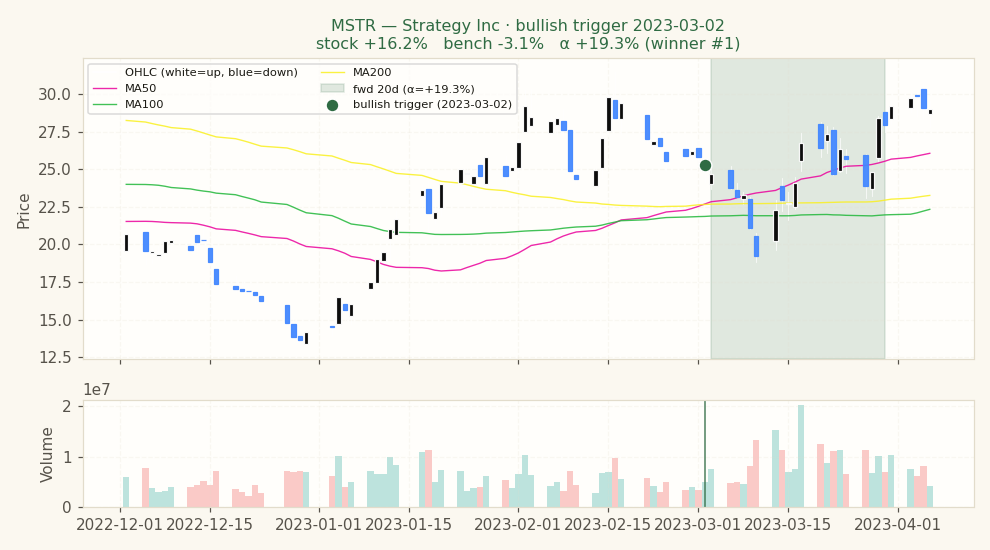
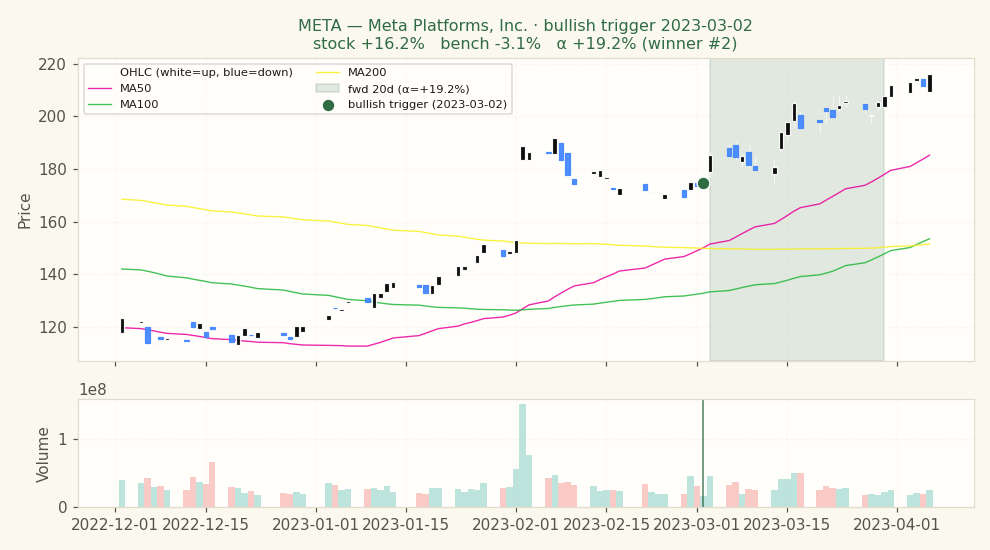
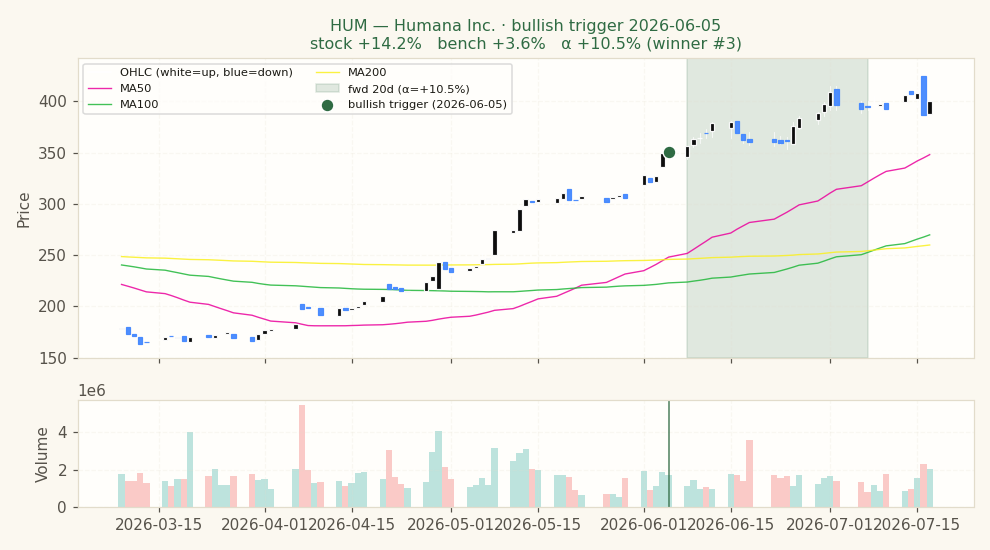
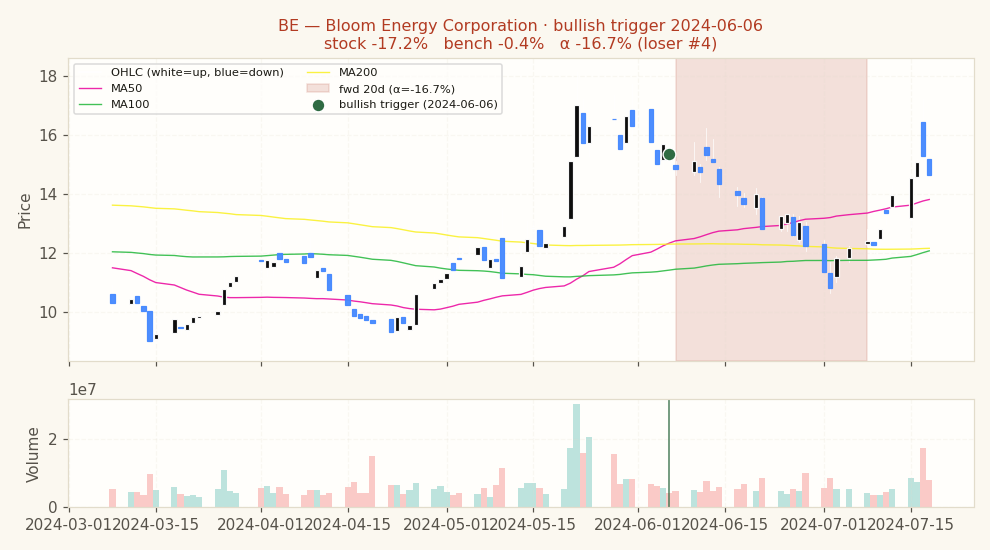
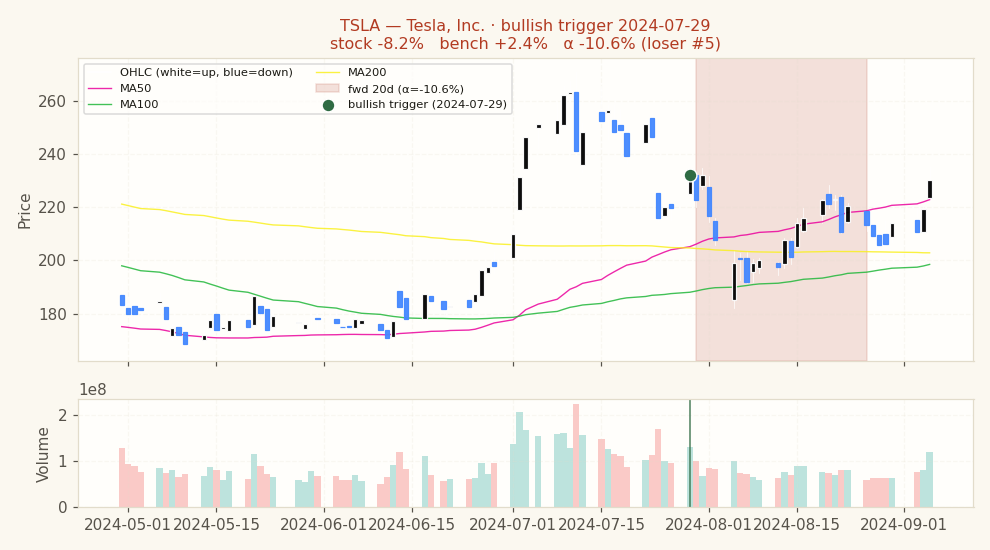
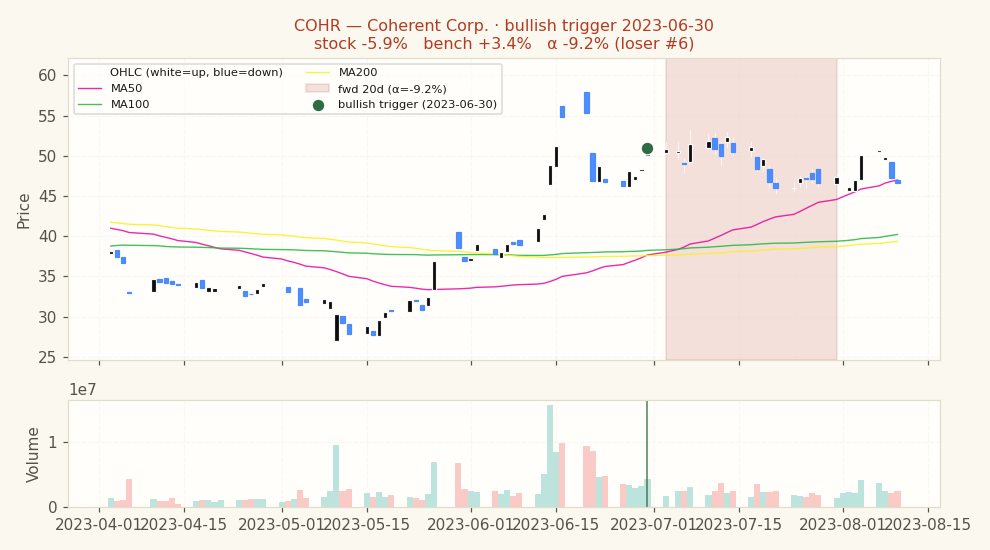
Six recent bullish TURNAROUND_CROSS triggers on US mega-caps, ranked within this sample of six: the top three and the bottom three, with extreme outliers excluded. Ranking is relative, not absolute — where the signal did well across the sampled names, even the bottom three can have beaten the benchmark, so the alpha printed on each panel is what settles it. Both groups are tail outcomes by construction; read them as the range, not the typical result.
Best three of the six sampled
Weakest three of the six sampled — not necessarily losses
Stock-regime quadrants (2×2 per-stock, 20d alpha detail table)
| Quadrant | N | Stock % (spxew) | Bench % (spxew) | Alpha % (spxew) | p (HAC) | Stock % (spx) | Bench % (spx) | Alpha % (spx) | p (HAC) | Stock % (msci) | Bench % (msci) | Alpha % (msci) | p (HAC) |
|---|---|---|---|---|---|---|---|---|---|---|---|---|---|
| Trending + Low vol Clean directional grind, low whipsaw | 133 | +0.08% | +1.76% | +1.00% | 0.5455 | +0.08% | +1.85% | +0.81% | 0.5608 | +0.08% | +1.79% | +0.86% | 0.5477 |
| Trending + High vol Crisis selloff or parabolic rally | 11,175 | +1.23% | +0.85% | +0.59% | 0.0939 | +1.23% | +1.34% | +0.00% | 0.9958 | +1.23% | +1.17% | +0.20% | 0.5511 |
| Non-trending + Low vol Quiet chop, summer doldrums | 19 | -2.61% | +2.60% | -5.49% | — | -2.61% | +2.23% | -5.12% | — | -2.61% | +2.72% | -5.61% | — |
| Non-trending + High vol Classical "whipsaw zone" for momentum | 2,164 | +1.23% | +0.93% | +0.28% | 0.7086 | +1.23% | +1.25% | -0.17% | 0.8240 | +1.23% | +1.07% | -0.06% | 0.9403 |
Sub-period breakdown table (20d alpha)
| Period | N | Alpha % (spxew) | p (HAC) | Alpha % (spx) | p (HAC) | Alpha % (msci) | p (HAC) |
|---|---|---|---|---|---|---|---|
| 2015-2019 2015-01-01 → 2020-01-01 | 1,976 | -1.58% | 0.0231 | -1.84% | 0.0089 | -1.59% | 0.0213 |
| 2020-2022 2020-01-01 → 2023-01-01 | 2,190 | +1.41% | 0.0064 | +1.33% | 0.0097 | +1.47% | 0.0030 |
| 2023-2026 2023-01-01 → 2099-01-01 | 3,304 | +1.19% | 0.0140 | +0.20% | 0.6676 | +0.39% | 0.4067 |
Methodology and caveats
How to read. Entry at open of T+1 (one trading day after the signal fires on close of T). 20d = open T+1 to close T+20. Alpha = stock return − benchmark return over the same window (Convention A, single-sided, textbook). For bullish triggers, POSITIVE alpha = signal was right. For bearish triggers, NEGATIVE alpha = signal was right (stock underperformed market). No sign-flipping; the direction of the bet determines what "good" looks like. Per-stock regime is each stock's own ADX(14) and RV(20) at the trigger date — not market-wide state.
Three p-values, three robustness tests. (a) p_naive: scipy one-sample t-test on winsorized alphas. Optimistic because overlapping 20d windows on the same ticker inflate effective N. (b) p_hac: Newey-West HAC with lag = horizon — corrects for the overlap and is the academic-finance standard. (c) p_perm: one-sided fraction of 200 random-date null iterations falling in the “signal was right” tail (mean ≥ observed for bullish; mean ≤ observed for bearish). Tests whether the signal beats random date selection at all. A signal that clears all three (pnaive, phac, pperm all < 0.05) has real information; a signal that fails pperm has not beaten random timing whatever the t-test says — and because the test is one-sided, a pperm up at its 1.000 ceiling is not "no edge" but inverted edge: every random draw served the claimed direction better than the trigger dates did.
Caveats. (i) Universe reflects today's active tickers; delisted losers pruned → survivorship bias. (ii) Mcap ≥ $100M filter uses today's snapshot, not point-in-time — mild lookahead on which stocks enter the sample, not on returns. (iii) Means and p-values use winsorized alphas (1/99 percentile) to prevent data errors from dominating. Medians and hit rates use raw data. (iv) Zero transaction costs assumed. Realistic bid-ask + commissions remove 20–40bps from 20d alpha on US large-caps, more on small-cap. Sub-20bps alpha is noise in practice. (v) Past performance does not predict future results.
How to use this
1 · When to reach for this signal
Use Turnaround Cross bullish as a long-side screening tile. Bullish 20d alpha is +0.55% and beats random (permutation test, 200 iterations). This signal fires bullish-only — there is no bearish variant.
These verdicts are 20-day holds vs S&P 500 Equal Weight. Longer horizons can differ in either direction — check the permutation detail tables below before extrapolating.
2 · When it works — the setups that drive it
- Best bullish setup: Trending + High vol — alpha +0.59% / 20d on 11,175 historical triggers.
- Best era for bullish: 2020-2022 — alpha +1.41% / 20d on 2,190 triggers.
3 · When it fails — common false positives
- Weakest bullish cell: Non-trending + High vol — alpha +0.28% / 20d on 2,164 triggers.
- Worst era for bullish: 2015-2019 — alpha -1.58% / 20d on 1,976 triggers.
Signal-specific failure patterns
4 · Pairing inside a screen
The statements below describe how this signal relates to others by construction — which indicator family it belongs to, and where same-family redundancy might reduce the independence of evidence inside a Daily Report. These are taxonomic classifications drawn from standard technical-analysis texts; they are not pairing backtests. This signal was not part of the tested set in the pair backtest run, so its pairing behaviour remains unmeasured.
Position in the multi-year range
In the study, requiring price to sit in the bottom third of its 5-year range at the trigger improved the result consistently, and depth-as-position-in-range beat its no-depth control monotonically across every window tested. This is not applied automatically by the screen. If you want it, add a range filter to the report or check the chart before acting.
What would likely rescue this signal
This block calls out the data or conditions that could turn a technically weak signal into a usable one in a composite screen. Based on signal mechanics and the observed failure patterns above; individual combinations are not yet backtested.
- Treat it as a candidate generator, not an entry — A 33% doubling rate over two years is a shortlist, not a trade. The useful workflow is to let the signal surface deeply depressed names that have started to turn, then apply separate fundamental or catalyst work before committing.
- Check liquidity before acting — Because production does not apply the study's $10M/day liquidity gate, sort or filter the report by turnover. Triggers on names below that level are outside the measured set and carry execution risk on top of signal risk.
See also Why technical-only signals don't survive on their own for the broader argument.
5 · Before acting — a 5-point checklist
- Normal trading day? Rule out earnings (within ±3 days), ex-dividend, or known corporate-action dates — the signal is almost certainly reading noise, not momentum, in those windows.
- Where is price vs its own 50 / 200 DMA? A trend signal is only as credible as the underlying trend it claims to confirm. Check the 200DMA orientation before acting.
- What's the sector breadth doing? An isolated signal in a broadly down-trending sector is a lower-confidence setup than one firing with the rest of its peer group.
- Is ADV20 enough for the intended size? A $1M notional order in a $500M name moves the tape by itself. A useful floor is adv20d ≥ 5% of the intended position.
- What invalidates the trade? Define a price level in advance (for longs: a close below the trigger-day low; for shorts: a close above the trigger-day high) and honour it. The backtest alpha is an average; any single trade can land at either tail.
Execution notes
Long-only: the signal has no bearish side. It fires when the 50-day average crosses above the 200-day while the 200-day is still at or below 0.70x its own 756-session maximum, and the 50-day has risen at least 12% over the preceding 20 sessions - that is, a cross that arrives with thrust rather than drift, on a stock still far below its multi-year peak. The 12% thrust threshold was swept and sits on a smooth plateau (neighbour gap 0.012 lift, rank correlation 1.00 between windows), so it is not a fitted spike. It is also deliberately conservative: lift kept rising past it in the selection window, but the held-out window peaked around 0.15 and the hit rate moved the wrong way out-of-sample, so the threshold was not pushed further.