52-Week Highs and Lows: Raw Count vs Fresh Breakout
The 52-week high is one of the most widely followed indicators in equity markets. The concept is straightforward: if today's high price equals or exceeds the highest price recorded over the prior 252 trading days, the stock is at a new 52-week high. The inverse applies for 52-week lows.
This is not some obscure technical indicator. The NYSE publishes daily counts of new 52-week highs and lows as a core breadth metric. The Hindenburg Omen — a widely tracked crash warning signal — requires simultaneous spikes in both new highs and new lows. Market regime models use the ratio of highs to lows to distinguish bull markets from bear markets. Institutional desks commonly monitor these numbers.
So what could traders possibly be getting wrong?
The noise problem
The standard 52-week high signal fires every day the condition holds. Think about what that means in practice.
If NVDA trends upward for 30 consecutive trading days, each one printing a new 52-week high, the conventional signal fires 30 times. For a portfolio manager running a daily screener, that means the same stock appears in the results every morning for a long time. For anyone receiving email alerts, it means 30 notifications about the same breakout event.
This is not the most useful information after the first day. The breakout happened once. The subsequent days are just continuation — the stock staying above its prior range. But the raw signal treats day 1 and day 30 identically, with no distinction between the initial breakout and its aftermath.
For breadth analysis, this repetition is fine. You genuinely want to know how many stocks sit at 52-week highs on any given day. But for screening and alerting, it creates a flood of redundant signals that drowns out fresh opportunities.
Two approaches in Chartlas
Chartlas solves this by offering two distinct versions of the signal, each designed for a different purpose.
Conventional 52-Week High/Low
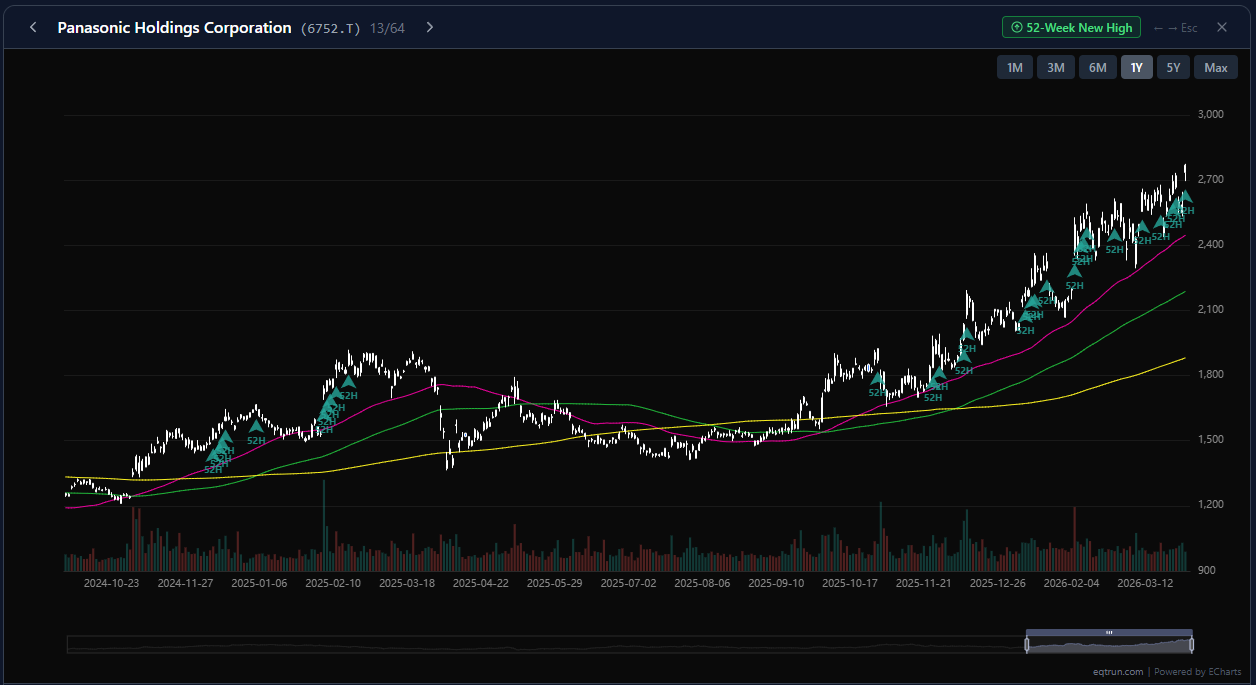
The 52-Week New High / New Low signal uses the standard institutional definition. It fires every day the condition is met, with no filtering or suppression.
This is the right choice when you need comprehensive counting. Breadth analysis depends on knowing exactly how many stocks are at new highs today versus yesterday. Regime detection models like the Hindenburg Omen require accurate daily counts of simultaneous highs and lows. If you are building dashboards or monitoring overall market health, you want every data point. Chartlas's public Breadth dashboard already tracks these 52-week high/low counts across markets and sectors, so you don't have to build the counting yourself.
Fresh 52-Week High/Low
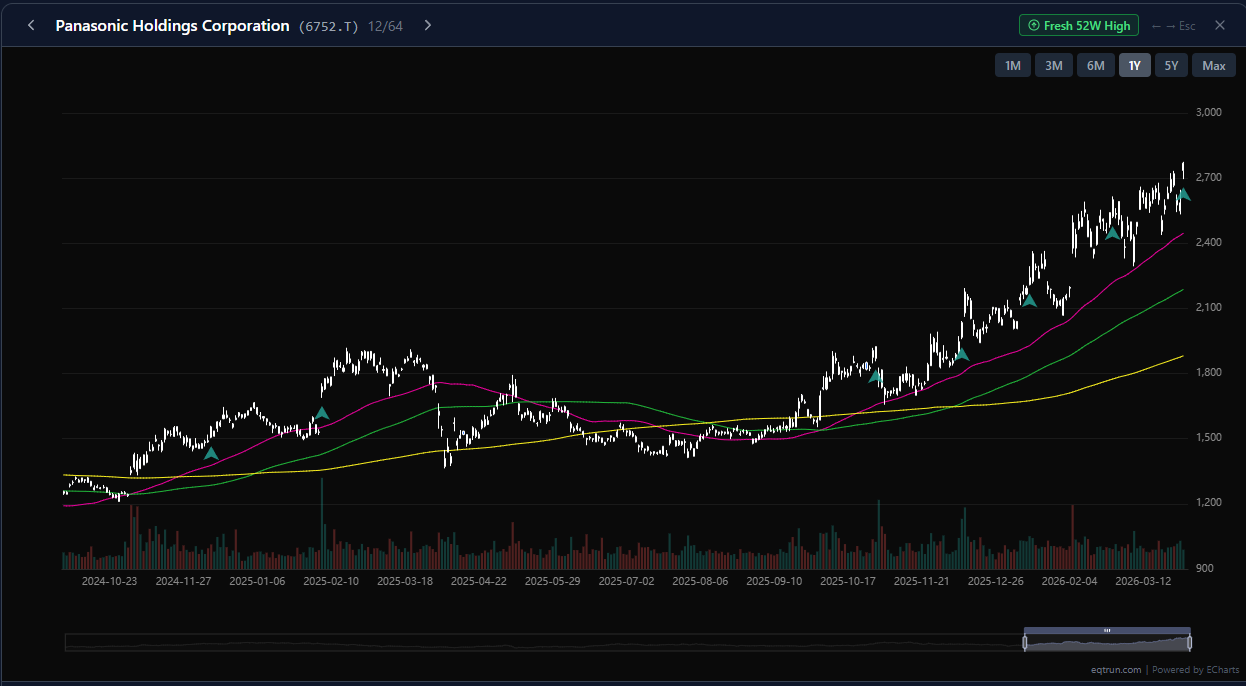
The Fresh 52-Week High / Low (with cooldown) signal takes a different approach. It fires on the first day of a breakout, then stays quiet for a 20-trading-day cooldown before it can trigger again.
This is the right choice when you care about discrete events rather than ongoing conditions. Email alerts become meaningful — one notification per breakout, not a daily reminder. Report results show genuinely new developments instead of the same names recycled day after day.
How the cooldown works
The mechanics are simple once you see them in action.
On Day 1, a stock breaks above its 252-day high for the first time. The fresh signal fires. You get your alert, and the cooldown clock starts.
During Days 2 through 21, the stock may continue making new highs every session. The conventional signal would fire each day, but the fresh signal stays suppressed. The cooldown is active, and the system recognizes this as continuation of the same breakout event.
From Day 22 onward, if the stock prints another new high, the fresh signal fires again. Enough time has passed that this likely represents a new move worth reviewing.
The 20-trading-day cooldown (the default — you can adjust it per report) corresponds to roughly one calendar month. This window is long enough to collapse a sustained trend into a single event, but short enough to catch distinct moves separated by consolidation periods.
Getting started
Both signal types are available when you build a Daily Report. Select Fresh 52-Week High / Low (with cooldown) when you want clean, deduplicated breakout alerts delivered to your inbox. Select 52-Week New High / New Low when you need the full daily count for breadth analysis and market regime monitoring. In either case, the direction toggle lets you restrict the signal to highs only (Bull), lows only (Bear), or both.
The choice comes down to your use case. Count everything, or catch what matters. With Chartlas, you do not have to pick one tool and force it to do both jobs.