Two new signals: range breakout and turnaround cross
I'm continuing to look for new patterns and signal combos, that could highlight potential turn around stories, or stocks that break out after some consolidation time. When I study large global universes of stocks - it narrows down the search. Or when I monitor my watchlist, it helps me to take decisions.
As usual the signals are filtering out the stocks in daily reports and are not expected to generate large consistent excess earnings. So be aware. But they are a good starting point to do some more research on the stock or the industry - prices are moving and this contains information already. Also, I don't use the signals in high-frequency or automated trading. Nothing of this is a recommendation to trade or use these signals. That's my own research that I use for my own market analysis. If it helps you, that's great.
So recently I deployed 2 new signals intended for that particular reason - find recovering stories - range breakout and turnaround cross. They complement the bearish trend breakout signal, currently available on the website.
Range breakout
Range breakout signal fires roughly 10x less often than the bearish trend breakout signals, which usually are clustering around the same period. The signal is intended to capture stocks that are starting to accelerate from their calmer/consolidation periods. The signal's performance tested on the Chartlas database (it contains only few delisted stocks, so survivorship bias is there) is similar to the bearish trend breakout. But it performs the best during low-volatility environment, while bearish trend breakouts have higher alpha in high volatility periods.
Examples that worked
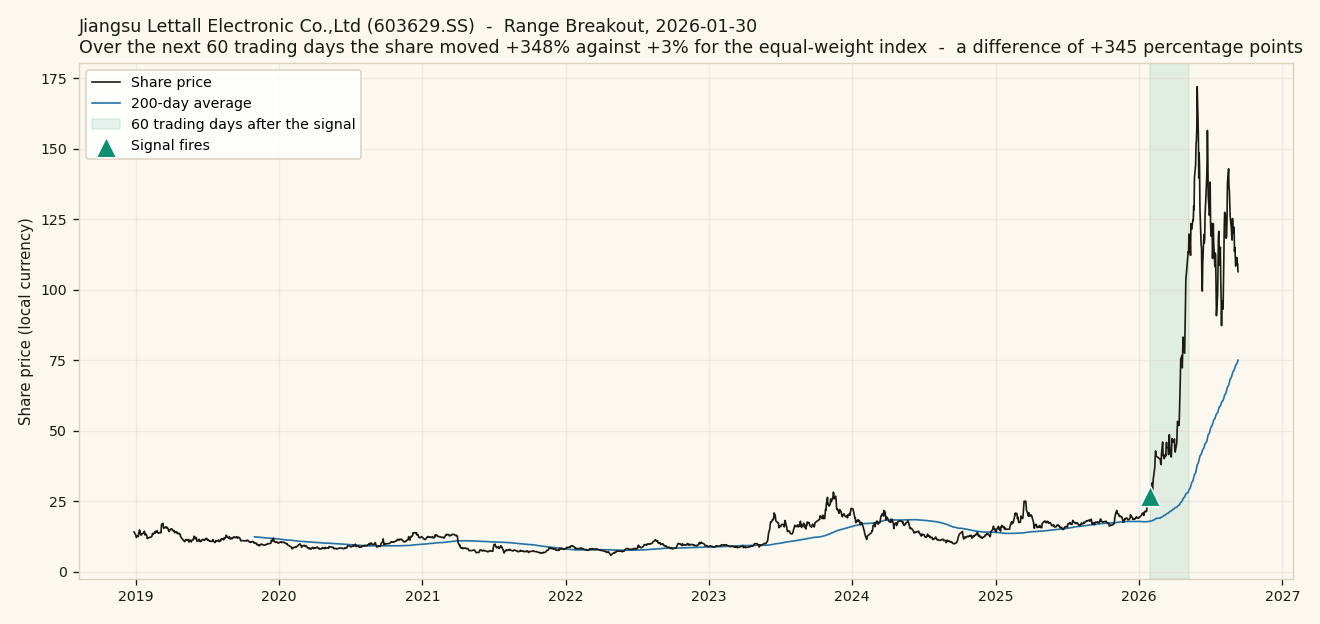
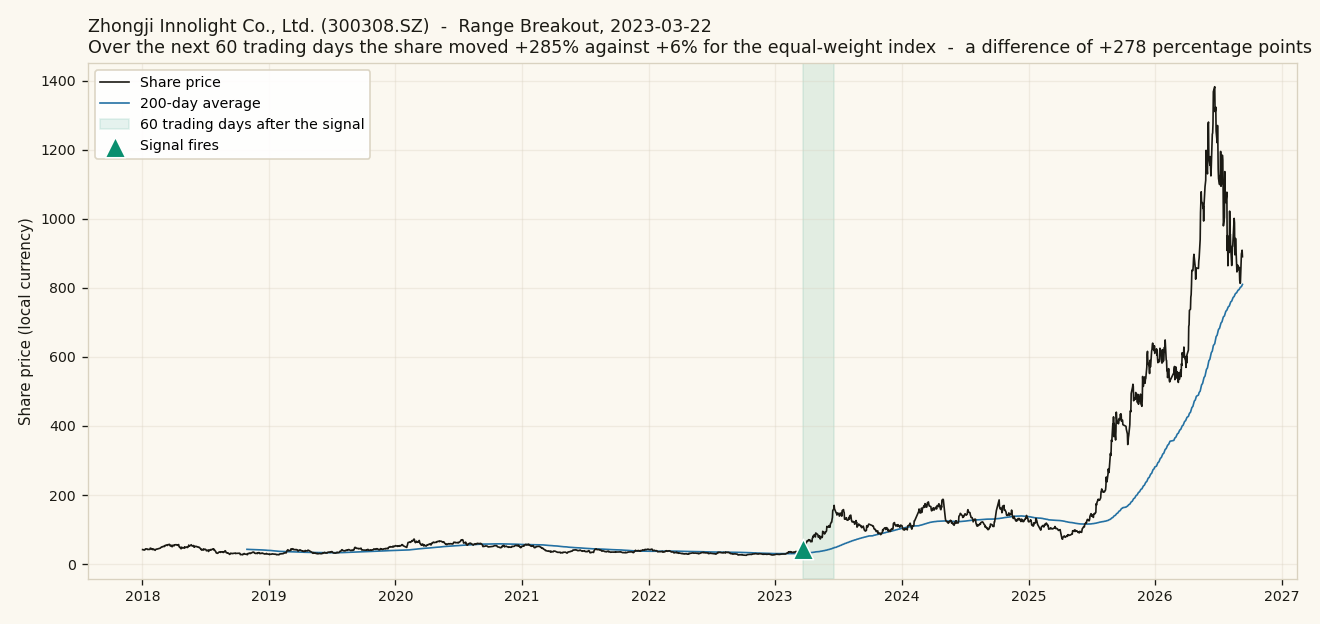
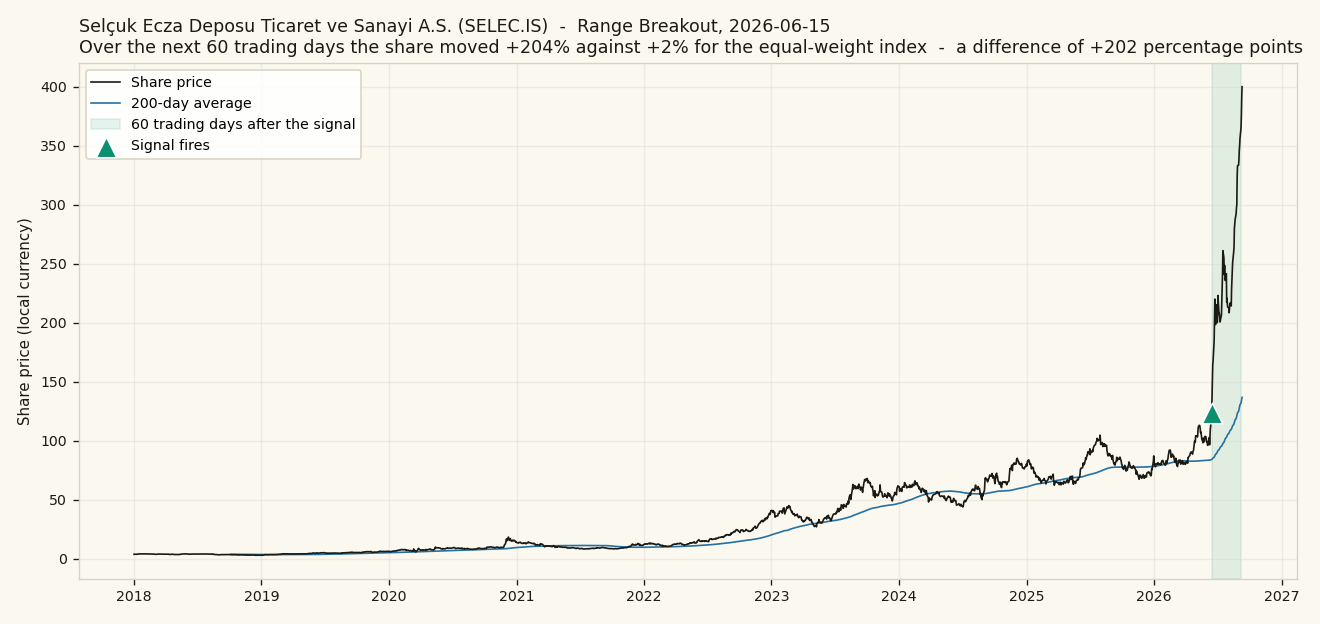
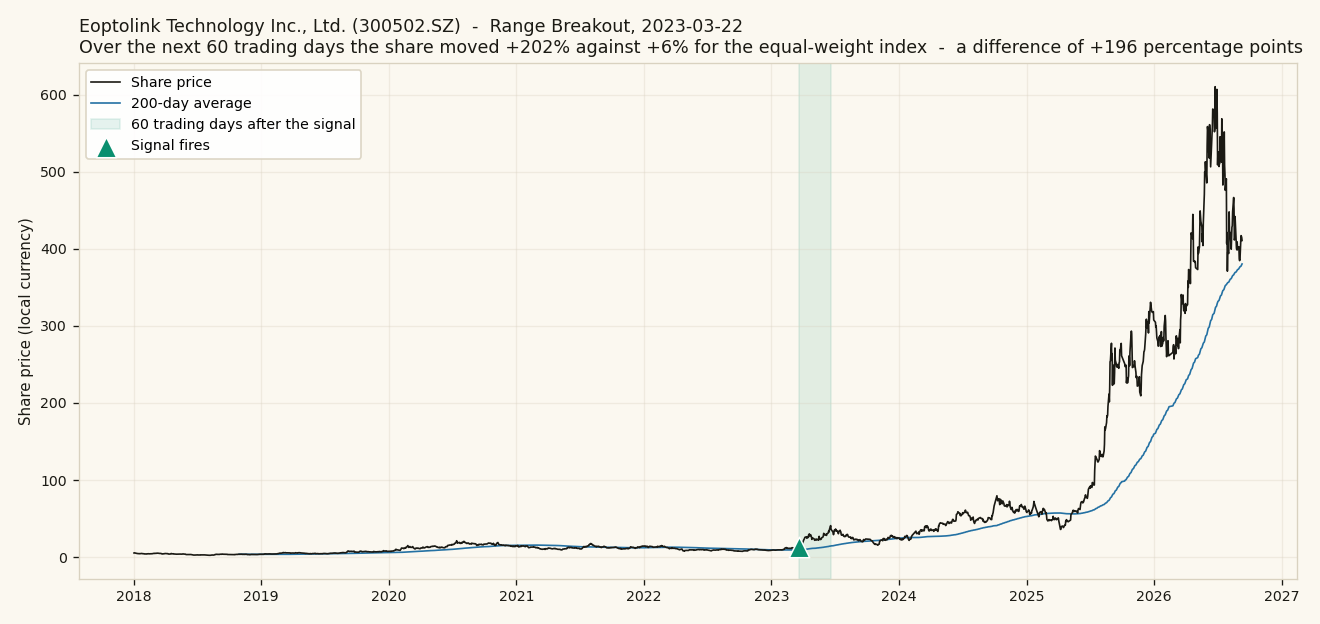
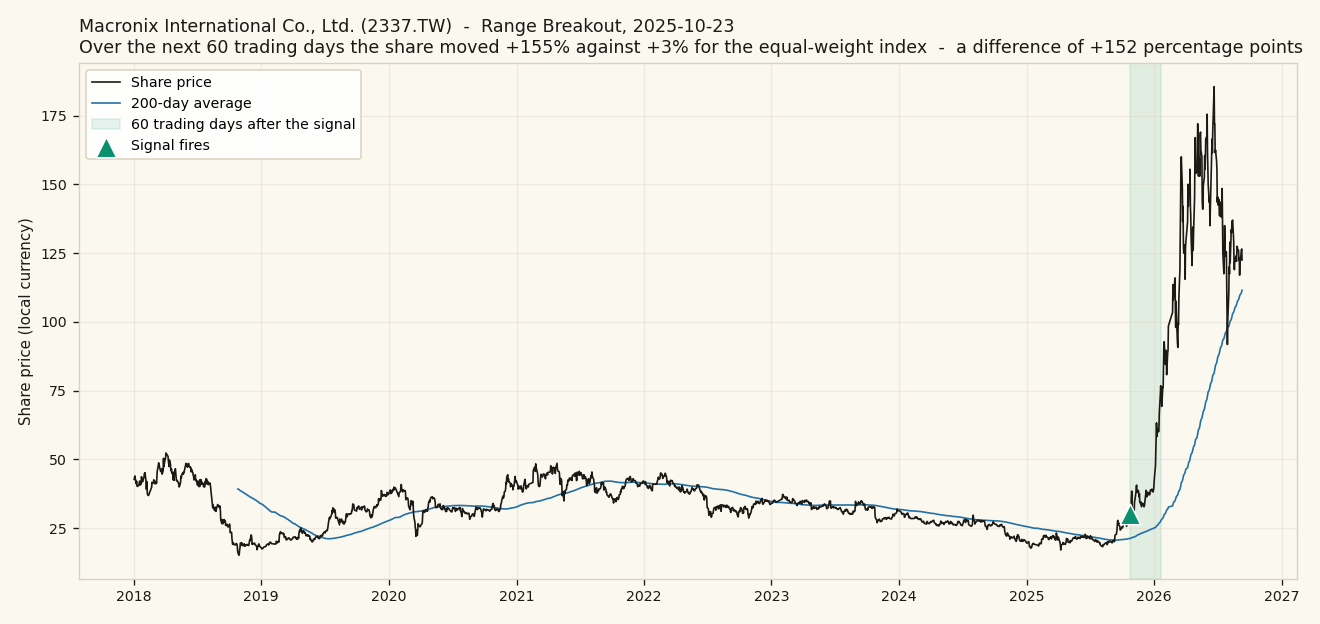
Out of every large-cap trigger since 2020 that cleared a $10M a day liquidity test, these are the five best over the following 60 trading days. They are the top of the distribution by construction, not typical:
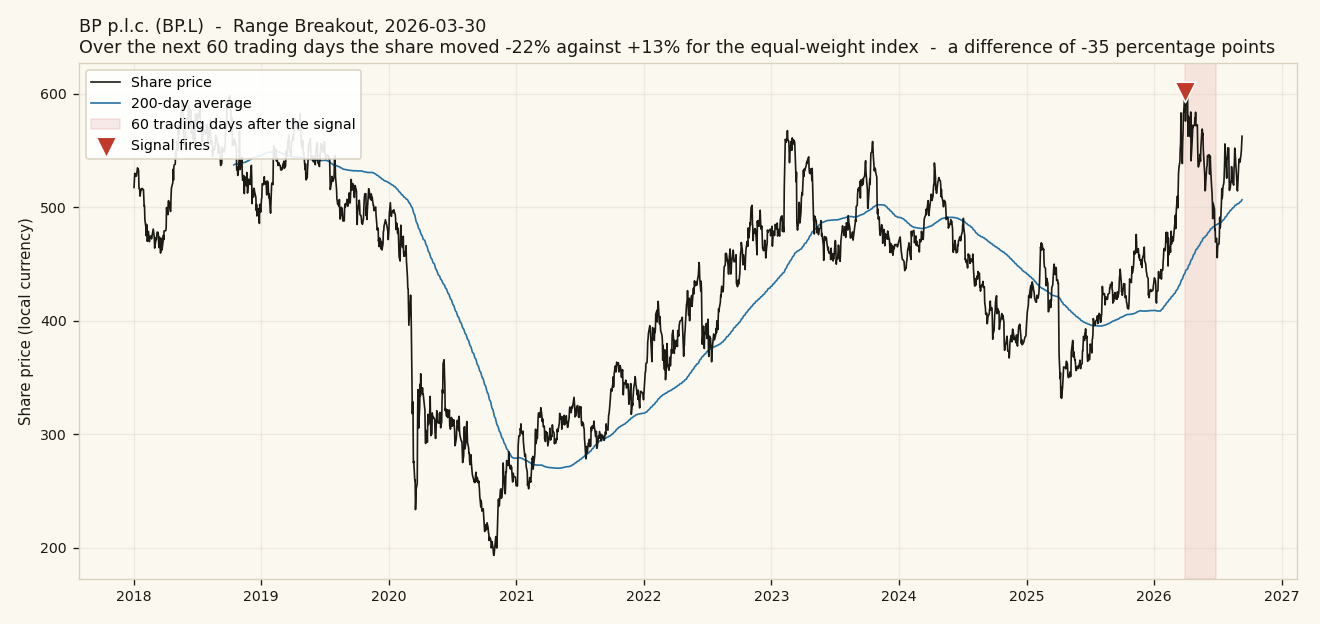
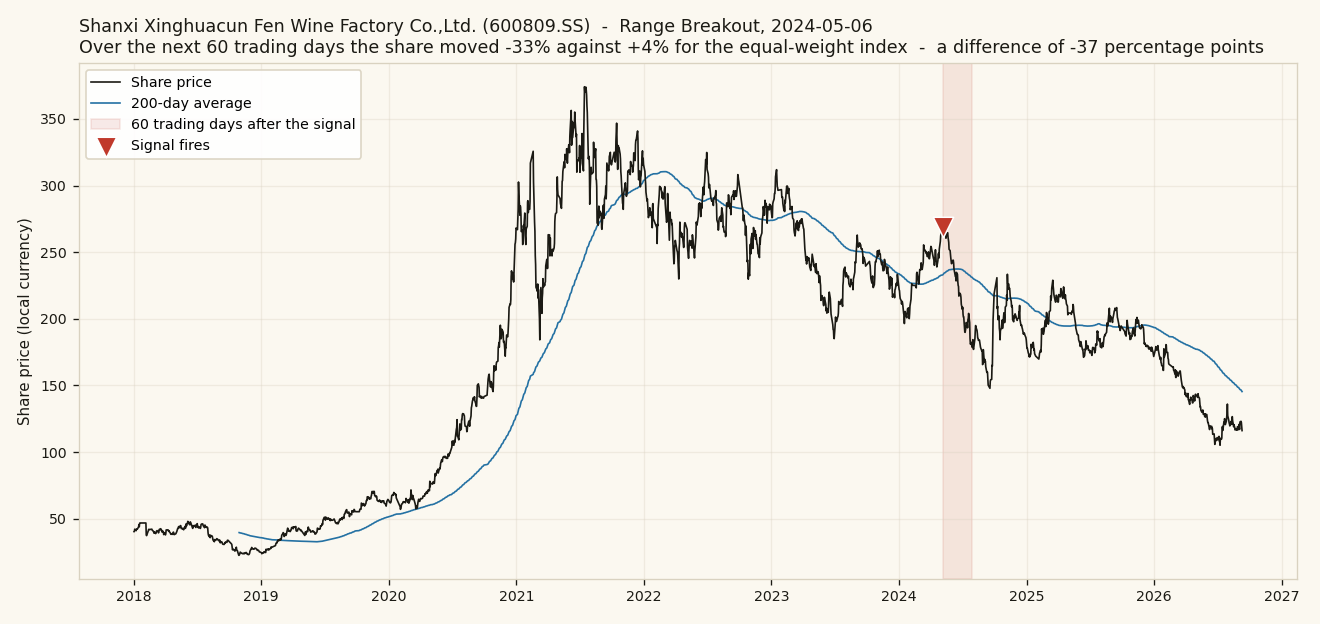
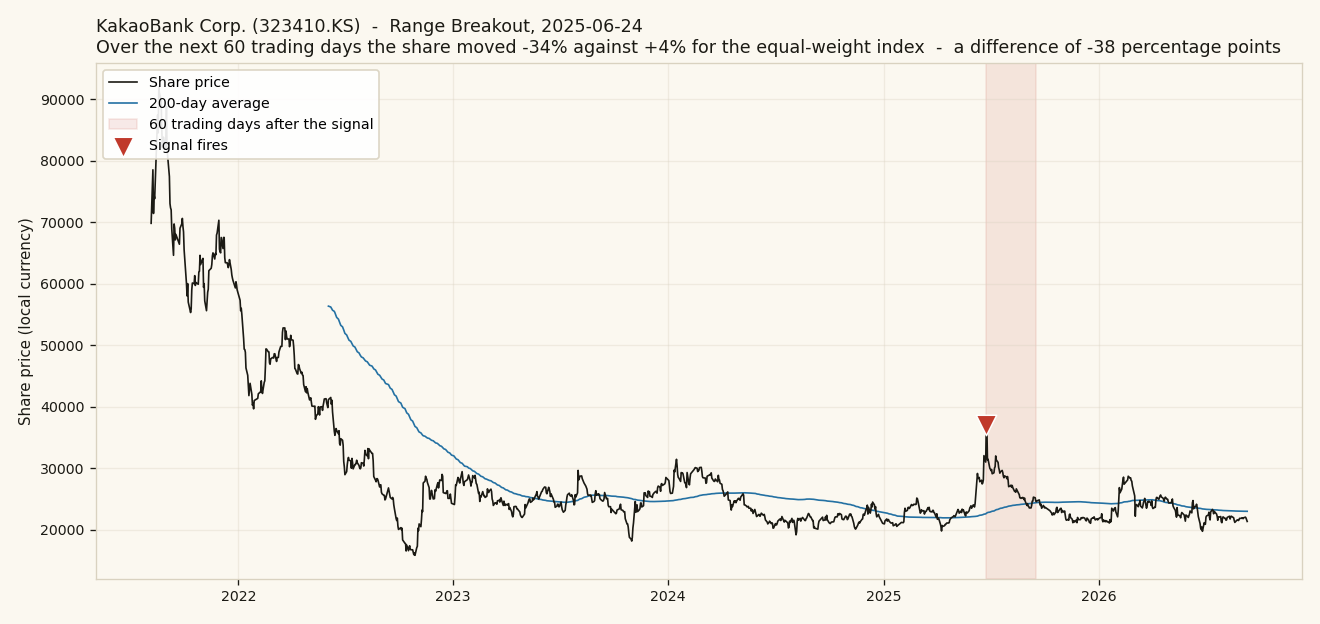
And five that did not
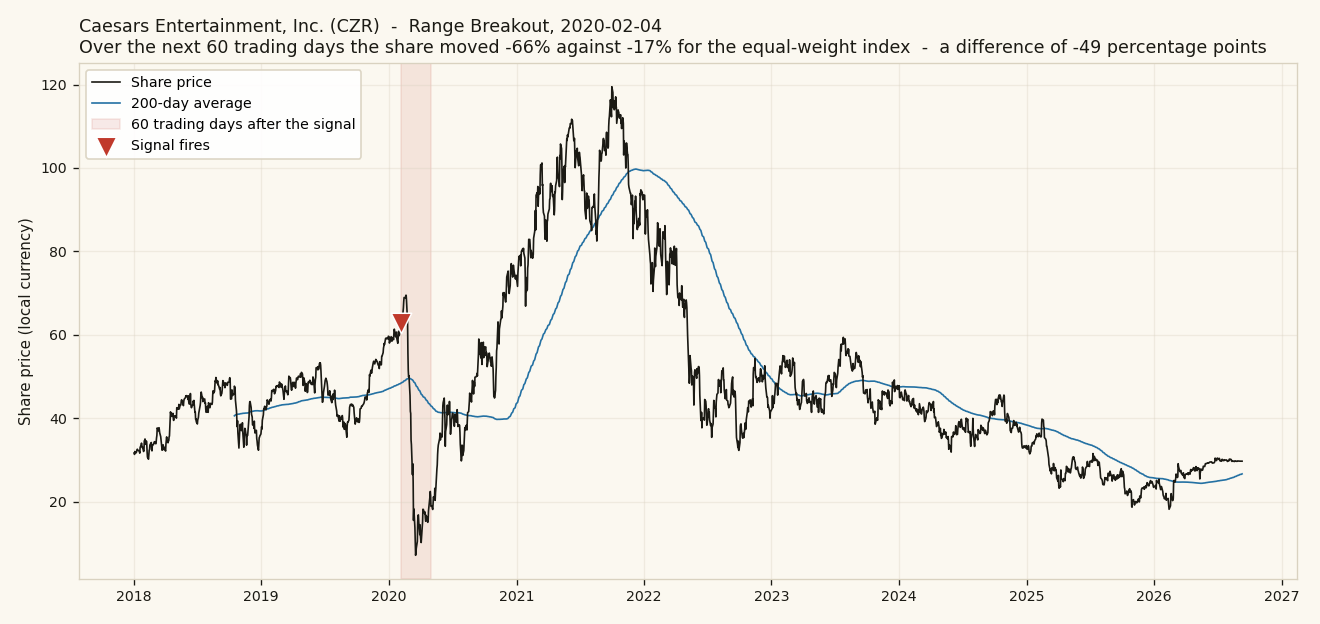
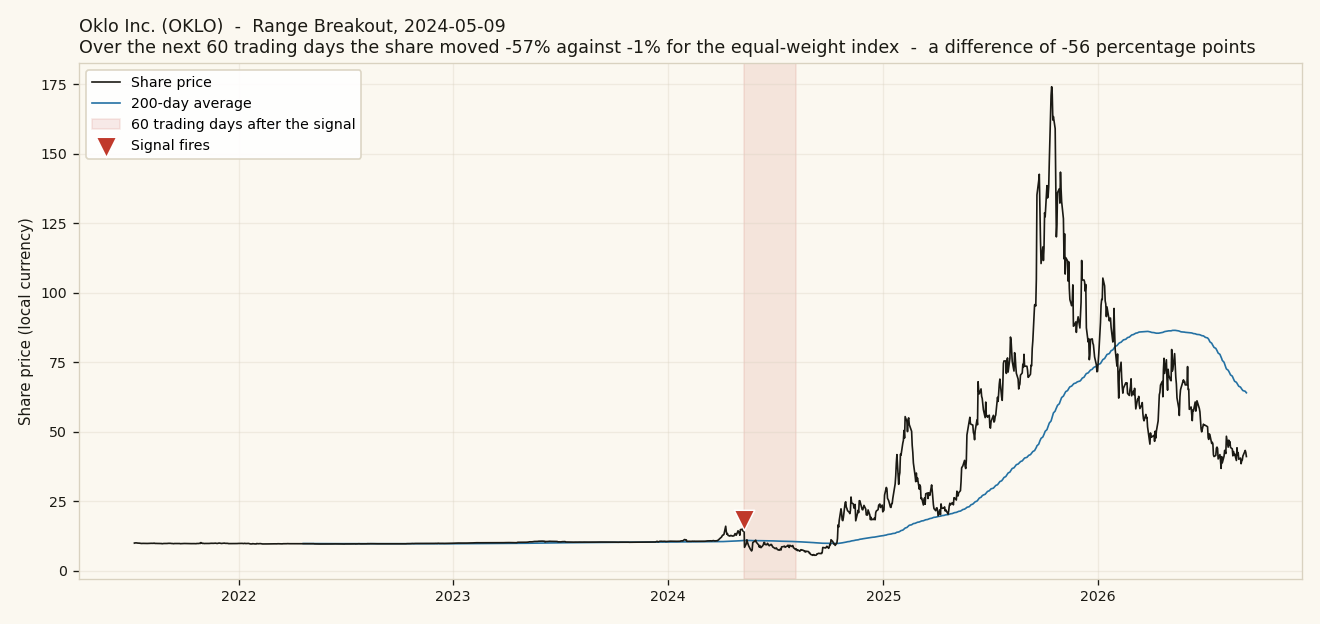
Turnaround cross
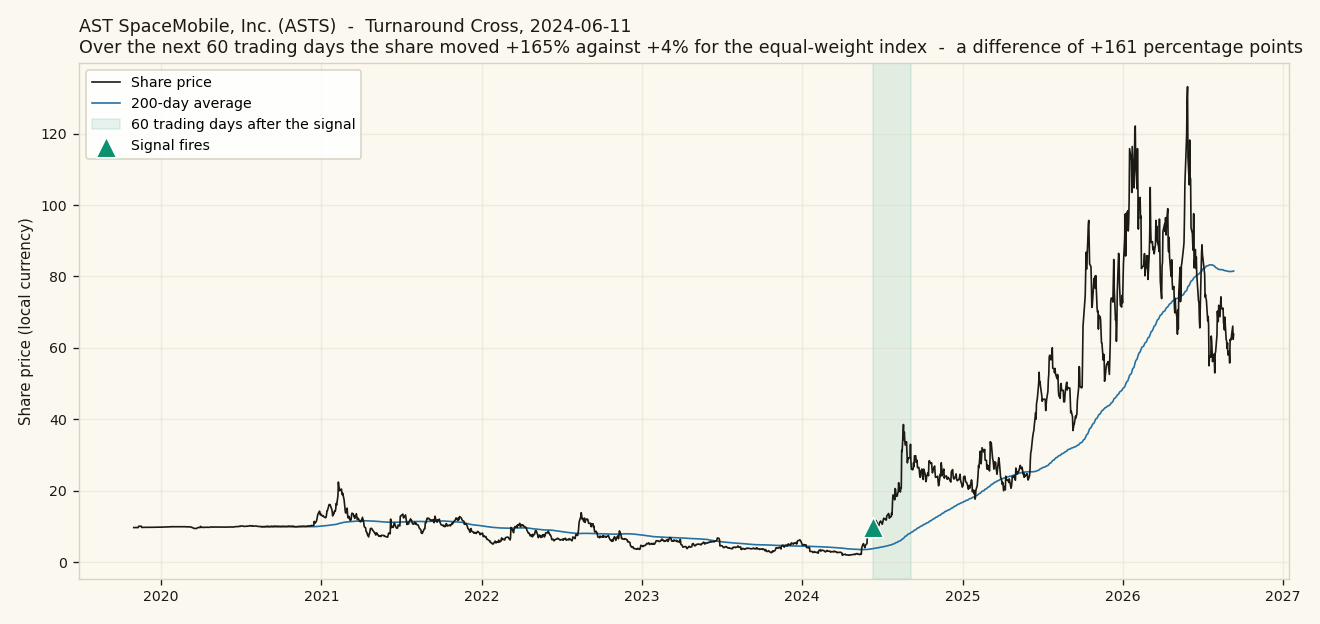
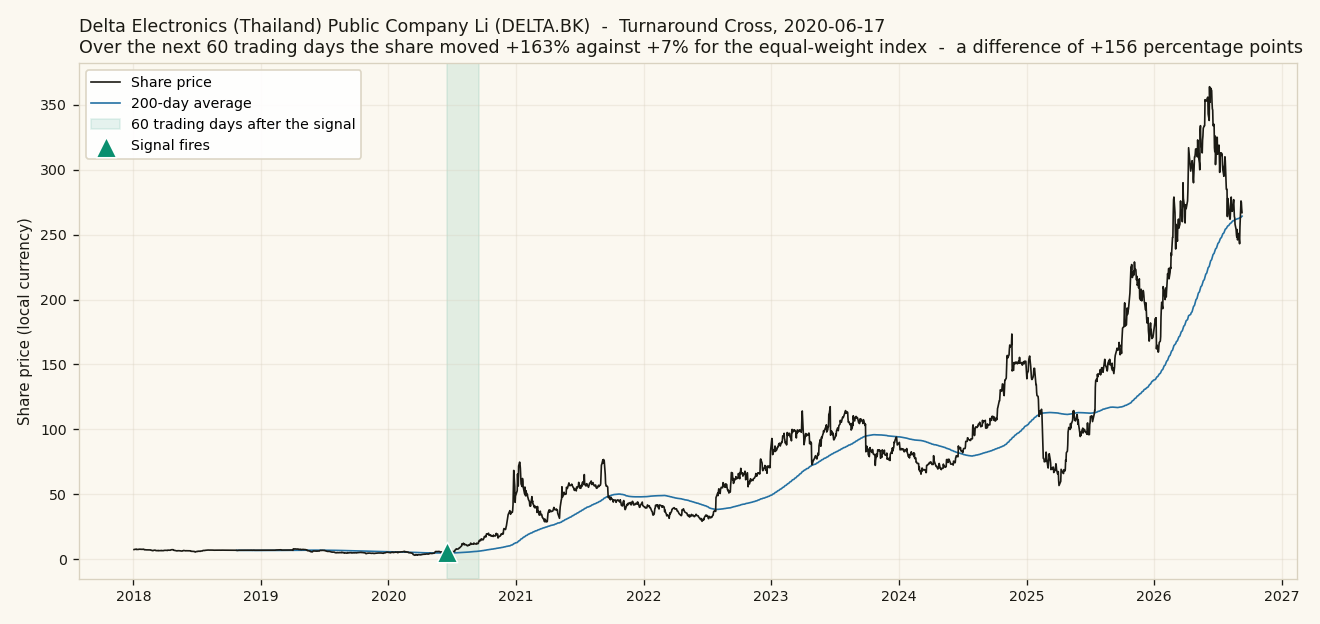
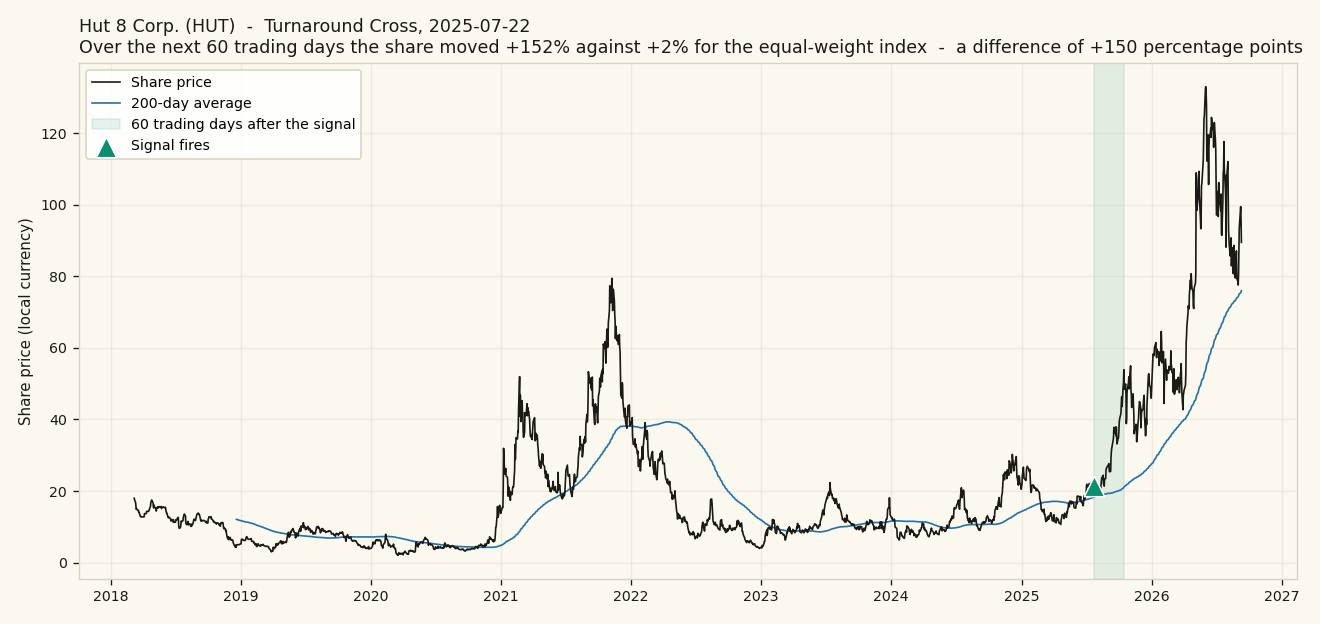
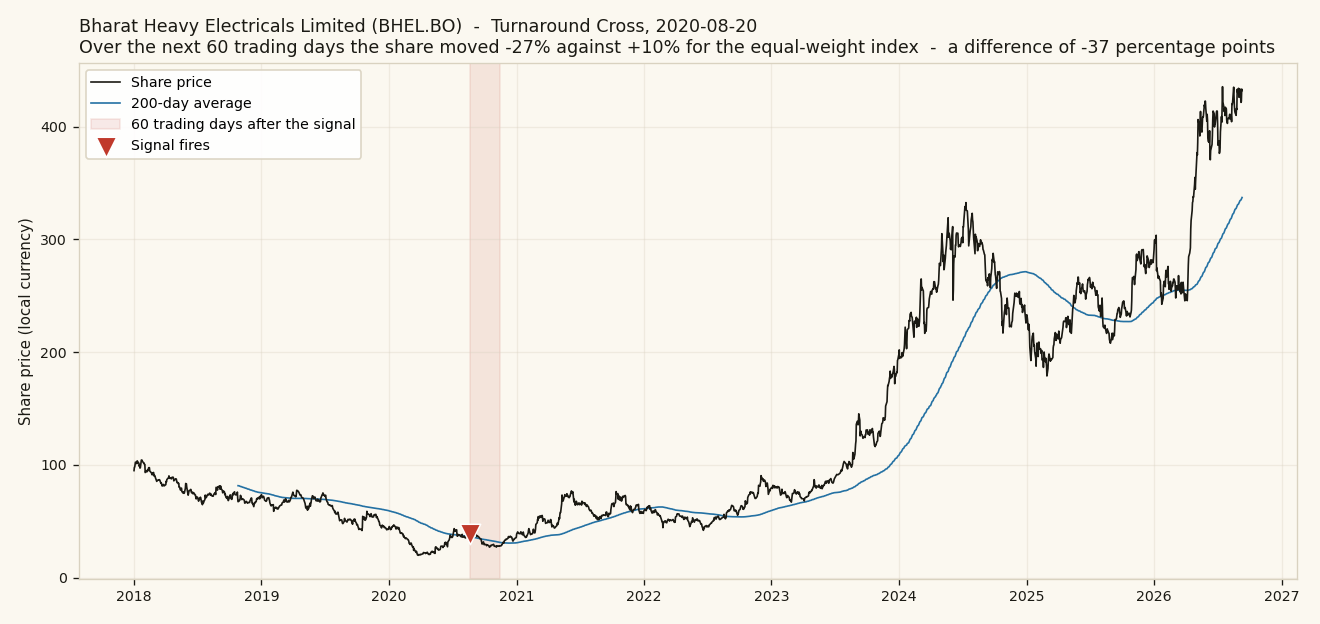
Another signal, that shows more interesting results in the tests - turnaround cross - stocks trading below long term highs for some extended time but are showing strong new momentum. It's a recovery from a deep decline. The signal fires roughly 4 times less often than the range breakout. It shows outperformance on average with large tails - the average trigger does well over one year. So minority of the triggered stocks drive the biggest returns. Again, it was tested on the Chartlas database, that misses many delisted stocks. It's not a recommendation, just to make sure.
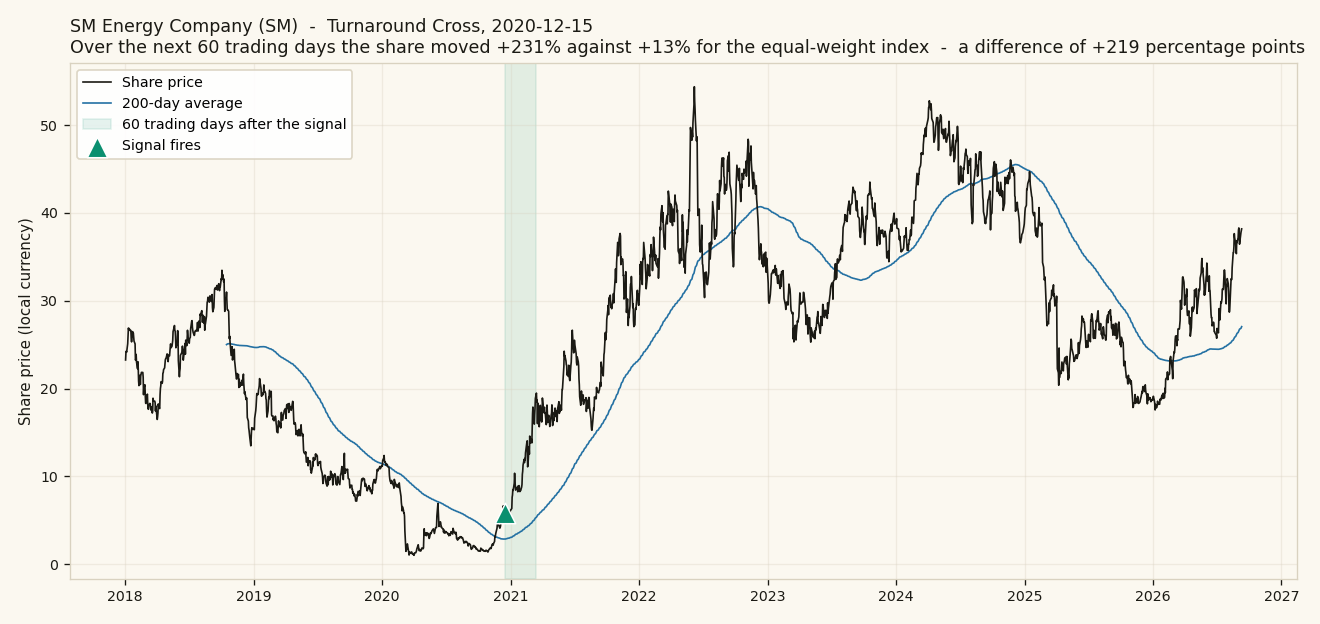
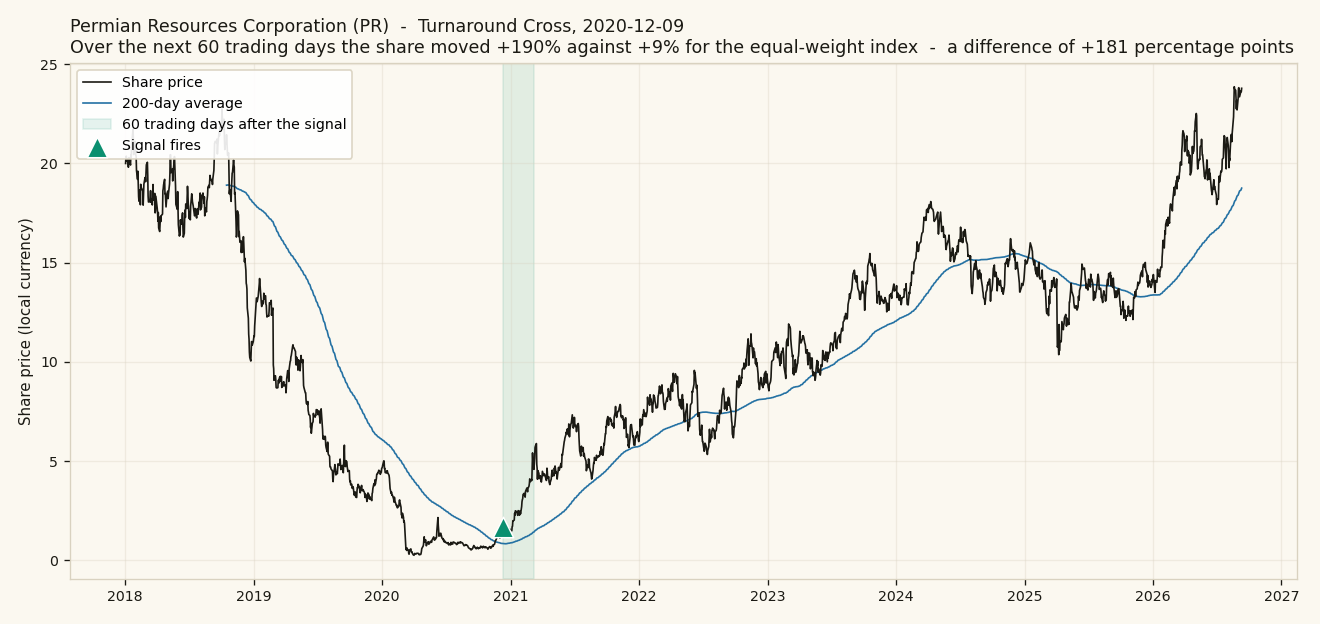
On timing, this one is mostly a recovery-market signal. Its best window by a distance was 2020-2022, where the average trigger beat the index by about 30% over the following year, against roughly 18% in 2023-2026 and 8% in 2015-2019. Similar top distribution examples:
Examples that worked
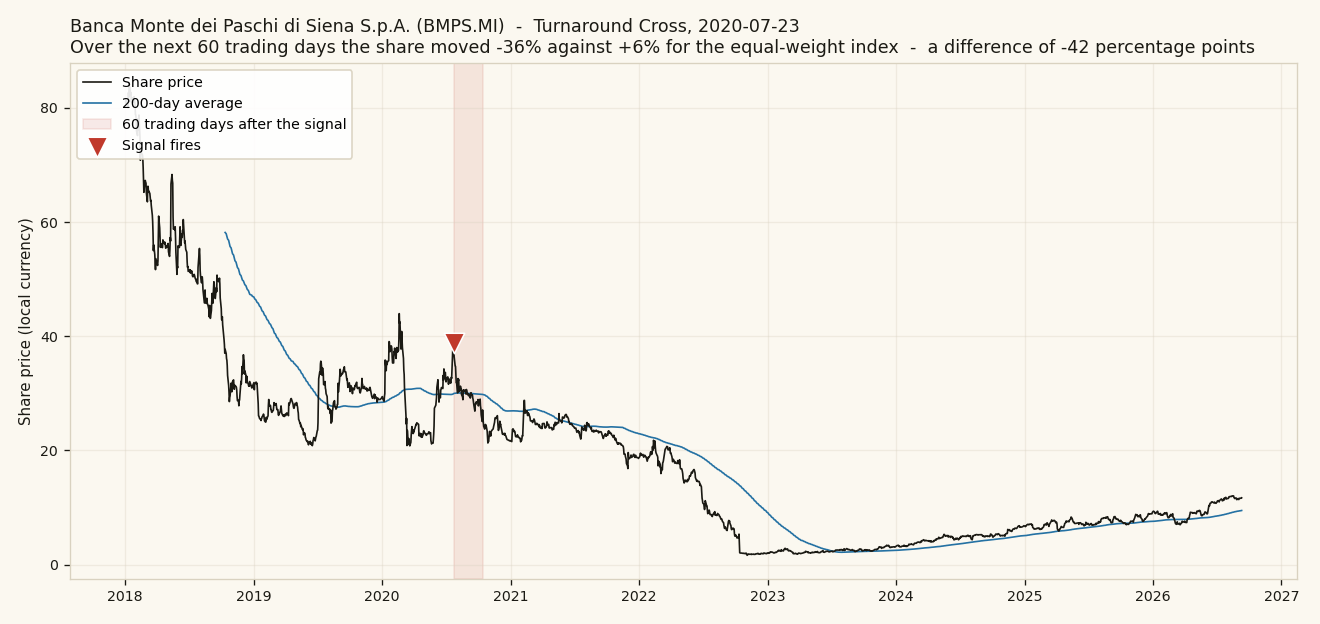
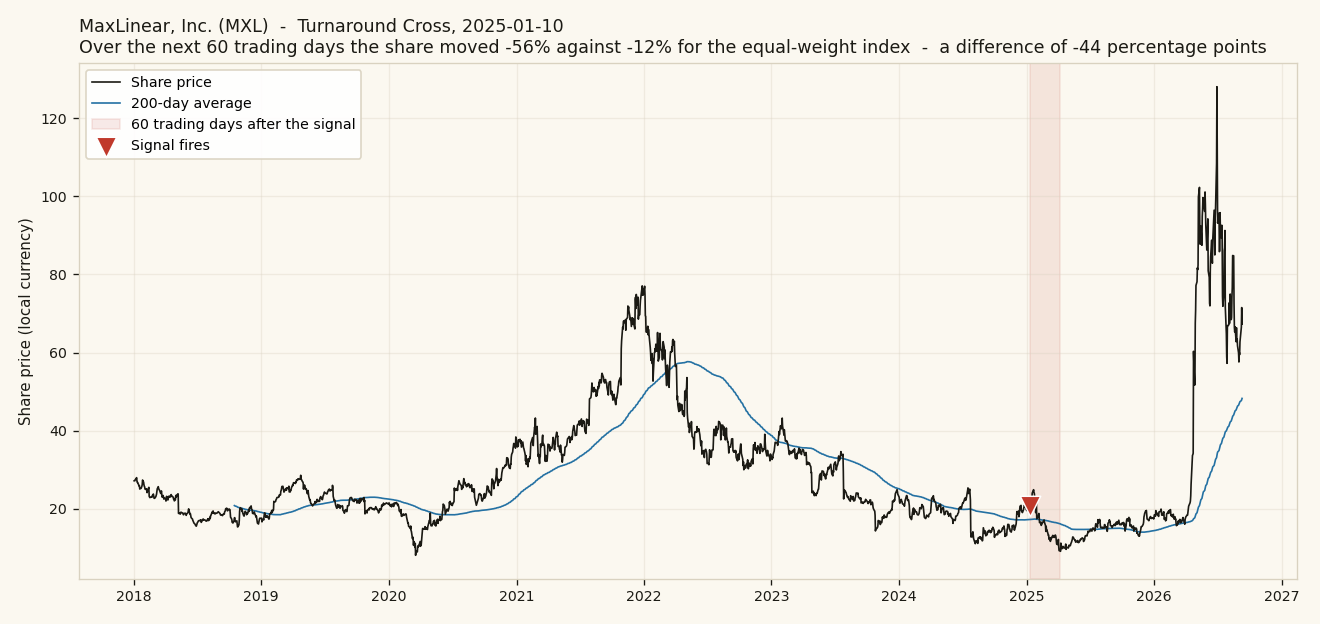
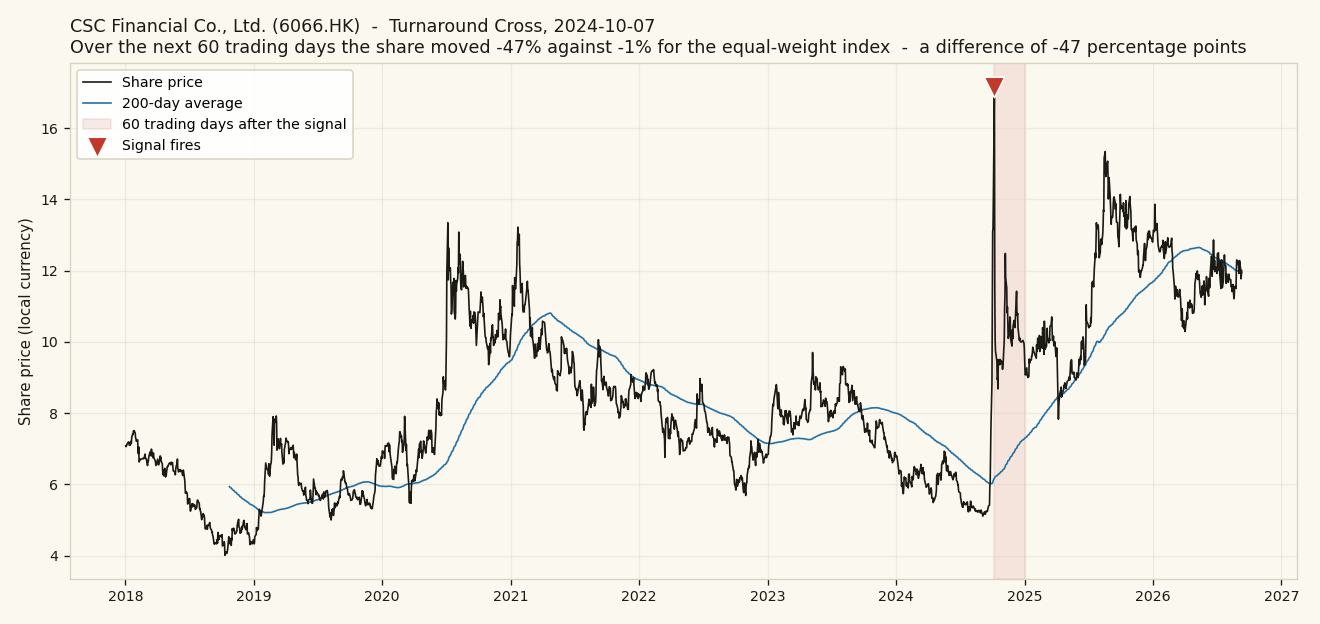
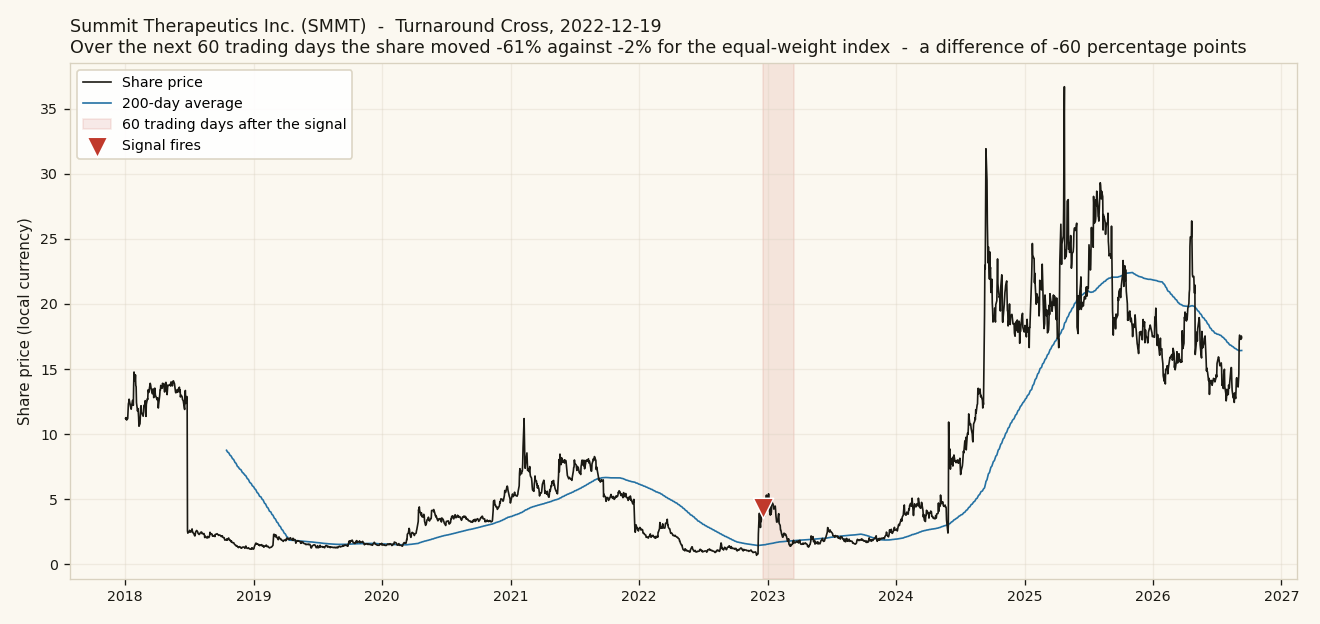
And five that did not
Summary
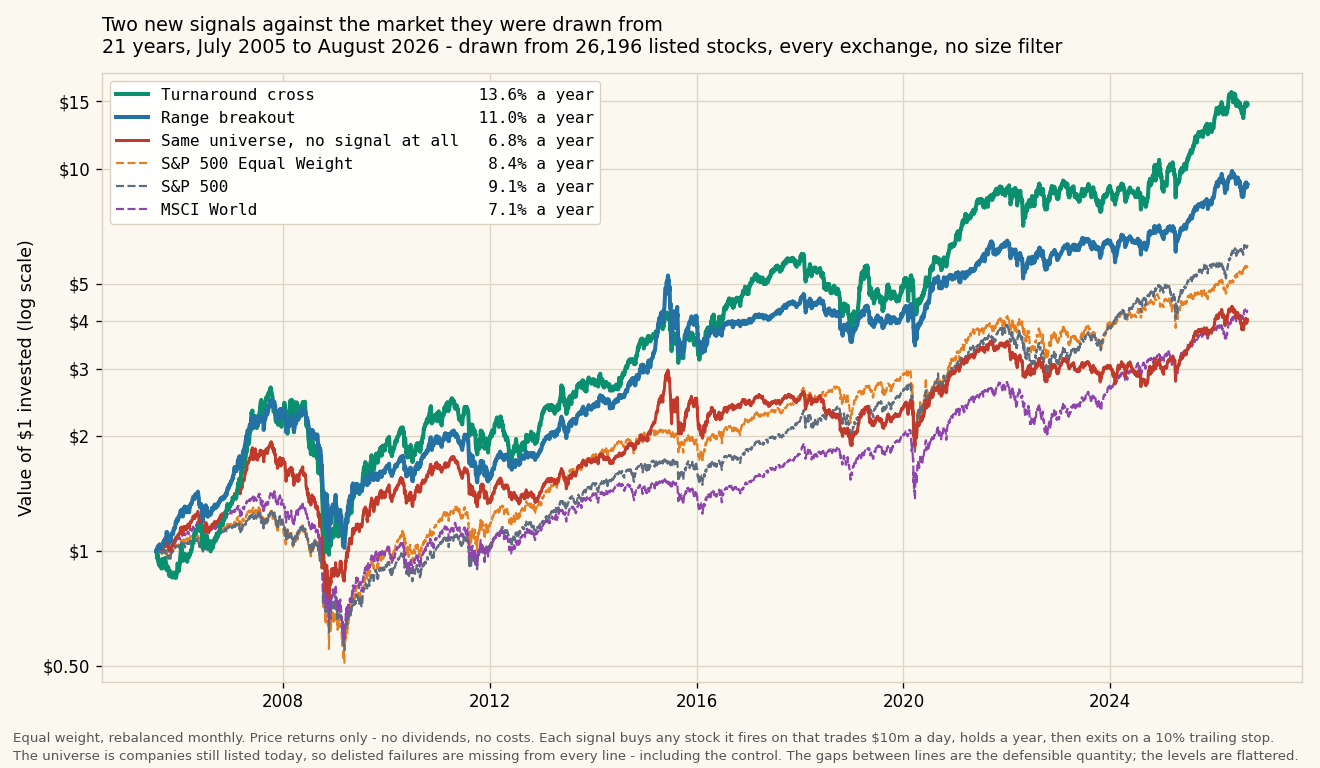
Over the last 21 years the signals provide upside to the same universe they were tested at. Comparisons to S&P and MSCI World are not completely apples-to-apples - just an illustrative example. Performance strategy is based on one year holding period and a trailing stop loss as an exit. Exit rules can alter the overall performance significantly.
The key conclusion is that it takes time for the stocks to turn around significantly.
What's important is to find fundamentally strong companies, sector leaders, and keep monitoring them for better entry point. That's my exercise with these signals.
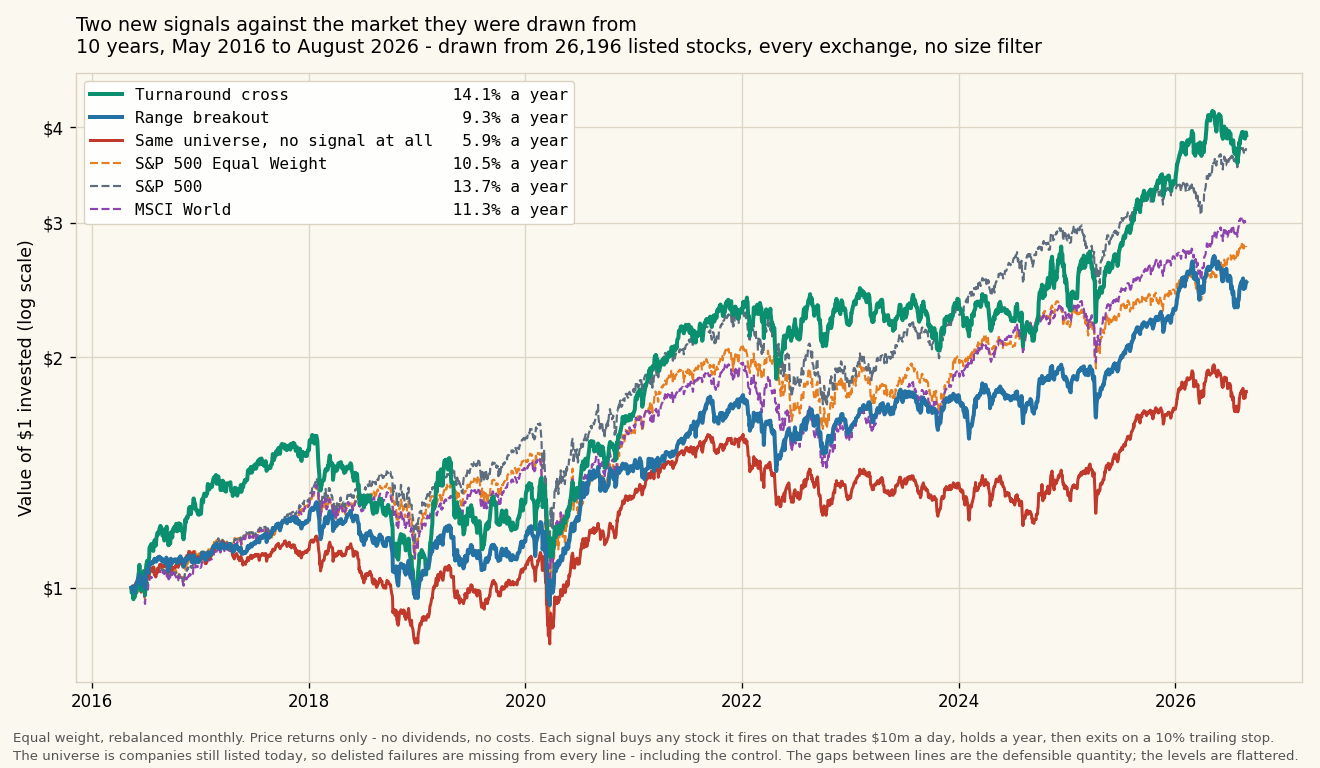
Tested over the last 21 years on the point-in-time liquid universe (docs page is tested on current market cap filter), and next to a control that buys the same universe with no signal at all (neglecting turnover and costs, which at 25bp a side would take roughly 1.5pp off each signal's annual return):
10-year performance drops for the range breakout in this scenario, but still beats the universe it was filtered from.
| Annual return, 21y | vs control, 21y | Volatility, 21y | Annual return, 10y | vs control, 10y | Volatility, 10y | |
|---|---|---|---|---|---|---|
| Range breakout | 11.0% | +4.2pp | 17.3% | 9.3% | +3.4pp | 14.0% |
| Turnaround cross | 13.6% | +6.8pp | 20.8% | 14.1% | +8.2pp | 18.8% |
| Same universe, no signal at all | 6.8% | — | 15.6% | 5.9% | — | 13.4% |
| S&P 500 Equal Weight | 8.4% | +1.6pp | 20.4% | 10.5% | +4.6pp | 18.2% |
| S&P 500 | 9.1% | +2.3pp | 19.2% | 13.7% | +7.7pp | 17.9% |
| MSCI World | 7.1% | +0.3pp | 16.5% | 11.3% | +5.4pp | 15.4% |
Everything above is measured on the Chartlas price database, which holds only a few delisted companies. That flatters every line in the table, including the control. The comparison between the lines is more reliable than any single one of them. I am not presenting this as a tradeable track record.
Aleksej