Weekly Market Breadth Report — July 10, 2026
Corrected 18 August 2026. This post was produced by an earlier breadth/regime engine later found to contain calculation errors. In this post: advance/decline figures were computed from a contaminated series and have been recomputed from the corrected data; one regime-signal takeaway was reworded — the signal did fire, but its forward-return framing did not survive revalidation; forward-return claims that rested on a backtest of the same faulty series have been dropped; 2 charts plotted from the old engine have been removed; the 'what happened' scorecard on the previous week's takeaways has been dropped. Price data, signal counts, ETF tables and index moves are unaffected.
This report is AI-generated from Chartlas's market data and breadth analytics. It is not human-written market commentary and does not constitute investment advice.
Market Overview
S&P 500 rallied this week (+1.2%) to 7,575. MSCI World (ACWI) gained +1.0% to 158. Momentum is weak (0/6) while trend is in the mid-range (2/6). Short-term selling pressure within a mixed structural backdrop. Best performer: Hang Seng (+3.5%). Weakest: DAX 40 (-2.8%).
| Metric | This Week | Last Week | 1Y Avg | Z (1Y) |
|---|---|---|---|---|
| Bullish Signal % | 45.3% | 60.5% | 54.2% | -1.2 |
| Bullish Signals | 102,346 | 145,081 | ||
| Bearish Signals | 123,588 | 94,545 |
This week's net balance skews bearish relative to the 1-year norm (z=-1.2).
Key Takeaways
- 🟡 S&P 500: Rallied +1.2% to 7,575, but breadth is not fully confirming. Price is moving up while internals remain mixed.
- 🟡 Breadth: Momentum is weak (0/6) while trend is in the mid-range (2/6). Short-term selling pressure within a mixed structural backdrop. Momentum just weakened — a fresh deterioration in short-term indicators.
- 🔴 Breadth — 200 DMA Breadth: At an extreme reading (z=-1.9). Uncommon weakness — could mark a washout or further downside.
- 🟡 S&P 500: A High/Low Divergence fired — the advance-decline line hit a 60-day high but new highs failed to keep pace. Descriptive context only; this signal fires often and was weak evidence on its own in our backtest.
Stocks with the Most Signals
Large-cap stocks ($10B+) with 5+ signals fired this week.
| Symbol | Name | Sector | Signals | Net | 1W % |
|---|---|---|---|---|---|
| U11.SI | United Overseas Bank Limited | Financial Services | 26 | +24 | +10% |
| SLF | SUN LIFE FINANCIAL INC | — | 25 | +5 | +0% |
| CXSE3.SA | Caixa Seguridade Participações | Financial Services | 23 | +21 | +7% |
| 000938.SZ | Unisplendour Corporation Limit | Technology | 23 | +19 | +27% |
| O39.SI | Oversea-Chinese Banking Corpor | Financial Services | 23 | +21 | +8% |
| D05.SI | DBS Group Holdings Ltd | Financial Services | 23 | +21 | +6% |
| ADANIENSOL.NS | Adani Energy Solutions Limited | Utilities | 22 | +14 | +5% |
| HEDEF.IS | Hedef Holding A.S | Financial Services | 22 | +16 | +20% |
Momentum Breadth
Short-term oscillators and price velocity indicators.
| Index | This Week | Last Week | Change | Z (1Y) | Trend |
|---|---|---|---|---|---|
| Advance / Decline | -12,223 | +17,987 | -30,210 | -0.8 | Flipped bearish |
| New 20D High/Low | -2,201 | +2,637 | -4,838 | -0.4 | Flipped bearish |
| MACD Breadth | -1,124 | +3,636 | -4,760 | -0.5 | Flipped bearish |
| RSI Extremes | -560 | +2,464 | -3,024 | +0.2 | Flipped bearish |
| Bollinger Band | -2,278 | +617 | -2,895 | -0.5 | Flipped bearish |
| Weekly Movers (±10%) | -2,430 | +2,056 | -4,486 | -1.2 | Flipped bearish |
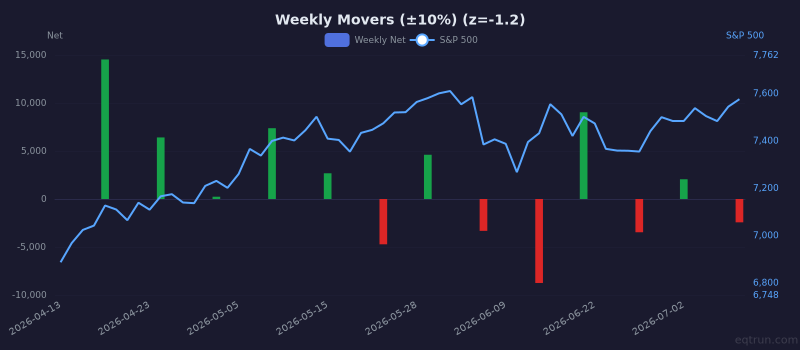
Weekly Movers (±10%) weekly net (bars) with S&P 500 price (right axis). 1Y z-score: -1.2.
Trend Breadth
Longer-term structural indicators.
| Index | This Week | Last Week | Change | Z (1Y) | Trend |
|---|---|---|---|---|---|
| 52-Week High/Low | -883 | -279 | -604 | -1.2 | Weakening |
| Fresh 52W High/Low | -315 | +123 | -438 | -1.6 | Flipped bearish |
| 200 DMA Breadth | -15,928 | -16,022 | +94 | -1.9 | Stable |
| MA Cross (Golden/Death) | -199 | -257 | +58 | -0.8 | Improving |
| HH/HL Structure | +16 | +69 | -53 | -0.6 | Deteriorating |
| Breakout / Breakdown | +505 | +766 | -261 | -0.5 | Deteriorating |
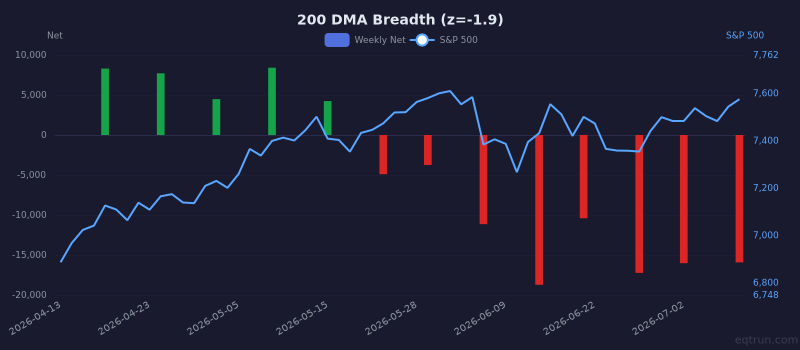
200 DMA Breadth weekly net (bars) with S&P 500 price (right axis). 1Y z-score: -1.9.
Pattern Breadth
| Index | This Week | Last Week | Change | Z (1Y) | Trend |
|---|---|---|---|---|---|
| Double Top/Bottom | -101 | +82 | -183 | -0.5 | Flipped bearish |
| Failed Pattern | +59 | +334 | -275 | +0.5 | Deteriorating |
Major ETF Signals
| Ticker | Name | Momentum | Trend | Pattern | Net | Z (1Y) |
|---|---|---|---|---|---|---|
| DIA | Dow Jones | 2↑ 5↓ | 4↑ | — | +1 | -0.1 |
| EFA | EAFE (Dev ex-US) | 3↑ 2↓ | 1↑ 1↓ | — | +1 | -0.1 |
| EEM | Emerging Markets | 4↑ | 1↑ 1↓ | — | +4 | +0.2 |
| QQQ | NASDAQ 100 | 2↑ | 2↑ 1↓ | — | +3 | +0.0 |
| USO | Oil (USO) | 4↑ | 1↑ | — | +5 | +0.9 |
| TLT | 20+ Year Treasury | 1↑ 2↓ | — | — | -1 | -0.4 |
| IWM | Russell 2000 | 1↓ | 1↑ 1↓ | — | -1 | -0.6 |
| HYG | High Yield Corp | 1↑ | 1↑ 1↓ | — | +1 | +0.1 |
| IBIT | Bitcoin | — | 2↑ | — | +2 | +0.4 |
| EWJ | Japan | — | 1↑ 1↓ | — | +0 | -0.4 |
| SPY | S&P 500 | 1↑ 1↓ | — | — | +0 | -0.7 |
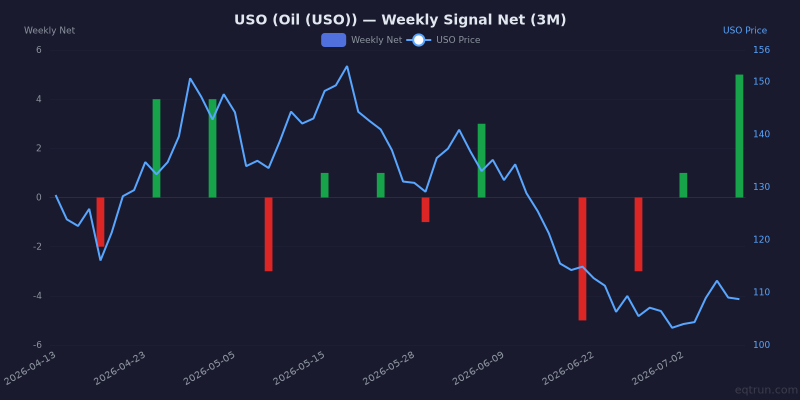
USO weekly net signals (bars) with USO price (blue line, right axis). 1Y z-score: +0.9.
Sector Breadth (Advance/Decline)
| Sector | Net | % Bullish | Z (1Y) |
|---|---|---|---|
| Energy | +212 | 53.4% | +0.4 |
| Financial Services | +16 | 50.1% | -0.1 |
| Communication Services | -130 | 48.5% | -0.0 |
| Utilities | -218 | 46.2% | -0.8 |
| Consumer Defensive | -243 | 48.3% | -0.1 |
| Real Estate | -390 | 46.8% | -0.5 |
| Healthcare | -954 | 45.8% | -0.4 |
| Consumer Cyclical | -1,530 | 44.7% | -0.7 |
| Technology | -1,950 | 44.2% | -0.8 |
| Basic Materials | -2,487 | 39.5% | -1.6 |
| Industrials | -3,733 | 42.1% | -1.2 |
What to Watch Next Week
- 200 DMA Breadth at -15,928. Improving but still negative.
- Advance / Decline just flipped — need follow-through to confirm.
Last Week We Said
From our report on July 03:
- 🟡 S&P 500: Rallied +1.8% to 7,483, but breadth is not fully confirming. Price is moving up while internals remain mixed.
- 🟢 MSCI World (ACWI): Gained +1.2%, tracking US markets. The rally is global.
- 🟢 Breadth: Momentum is strong (6/6) with trend in the mid-range (3/6). Broad short-term participation while the structural picture is still mixed. Need trend confirmation for a sustained move. Momentum improved from last week. Trend is recovering.
Get this report in your inbox every Saturday
Free for all Chartlas users. Plus daily signal alerts, custom screens, PDF exports, and live breadth/regime dashboards.
Create free account →