Weekly Market Breadth Report — August 14, 2026
This report is AI-generated from Chartlas's market data and breadth analytics. It is not human-written market commentary and does not constitute investment advice.
Market Overview
S&P 500 was roughly flat this week (+0.4%) to 7,786. MSCI World (ACWI) gained +0.5% to 162. Momentum (3/6) and trend (3/6) are both in the mid-range — near-baseline forward returns historically. Best performer: Nikkei 225 (+4.7%). Weakest: Hang Seng (-2.1%).
| Metric | This Week | Last Week | 1Y Avg | Z (1Y) |
|---|---|---|---|---|
| Bullish Signal % | 49.5% | 61.1% | 53.3% | -0.5 |
| Bullish Signals | 86,600 | 117,183 | ||
| Bearish Signals | 88,357 | 74,461 |
Signal balance is near its 1-year norm — nothing unusual this week.
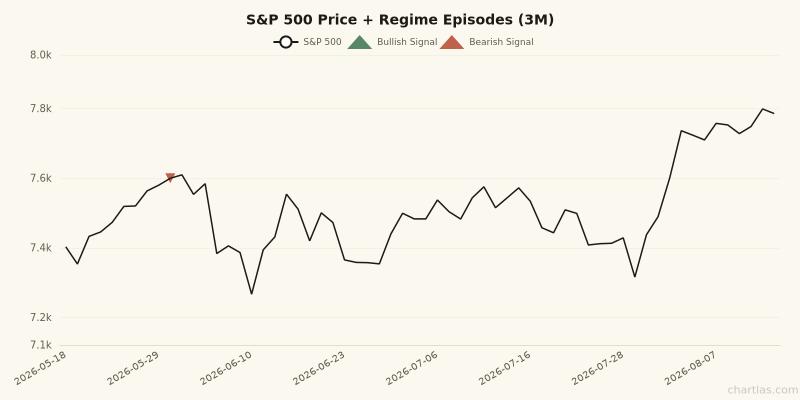
S&P 500 with regime episode markers — one marker per episode, matching the /regime monitor. Green = washouts / 90% up-volume days, red = global Hindenburg episodes / 90% down-volume days.
Key Takeaways
- 🟡 S&P 500: Flat this week at 7,786 (+0.4%).
- 🟡 Breadth: Momentum (3/6) and trend (3/6) are both in the mid-range. Near-baseline forward returns — no strong directional signal from breadth.
- 🟡 The regime board is quiet. No washout (72% above the 200-DMA), no capitulation days, last global Hindenburg episode Jun 1, 2026. Quiet is information too.
Stocks with the Most Signals
Large-cap stocks ($10B+) with 5+ signals fired this week.
| Symbol | Name | Sector | Signals | Net | 1W % |
|---|---|---|---|---|---|
| BMRN | BioMarin Pharmaceutical Inc. | Healthcare | 19 | +11 | +6% |
| BS6.SI | Yangzijiang Shipbuilding (Hold | Industrials | 17 | +11 | +10% |
| PAYTM.NS | One97 Communications Limited | Technology | 17 | +11 | +11% |
| MASQ.AE | Mashreqbank PSC | Financial Services | 17 | +17 | +15% |
| ONON | On Holding AG | Consumer Cyclical | 17 | -7 | -14% |
| 0992.HK | Lenovo Group Limited | Technology | 17 | +11 | +20% |
| 6696.TWO | Lin BioScience, Inc. | Healthcare | 17 | +13 | +31% |
| TPR | Tapestry, Inc. | Consumer Cyclical | 16 | -10 | -21% |
Regime Monitor
The three breadth conditions that carried a measured forward edge in our backtest, tracked as episodes. Full detail at chartlas.com/regime.
| Marker | State on Aug 14, 2026 | Last episode | Past 12 months |
|---|---|---|---|
| Breadth washout (S&P, <20% above 200-DMA) | 71.5% — neutral zone | Apr 8, 2025 | 0 |
| Hindenburg Omen (global universe) | quiet | Jun 1, 2026 | 3 episodes |
| 90% volume days (S&P) | none this week | down-day: Dec 31, 2025 | 2 down, 0 up |
How we read it: nothing on the board argues for either aggression or defense right now — the washout gauge sits at 72%, mid-zone. The overbought line at 80% is the nearer boundary if the current move extends. 3 global Hindenburg episodes inside twelve months is above the long-run cadence of roughly two — the split-market condition (heavy new highs and new lows together) keeps recurring, and the month after an episode has averaged about three points below a typical month in our history. The most recent (Jun 1, 2026) is stale; a fresh one would move this from footnote to headline. No 90% volume days this week (last down-day episode: Dec 31, 2025).
Where the Signals Are — Industry Scan
The week's cumulative signal net per industry (Investable universe), scored against that industry's own year of weekly readings. Click any name to open it in the Explorer.
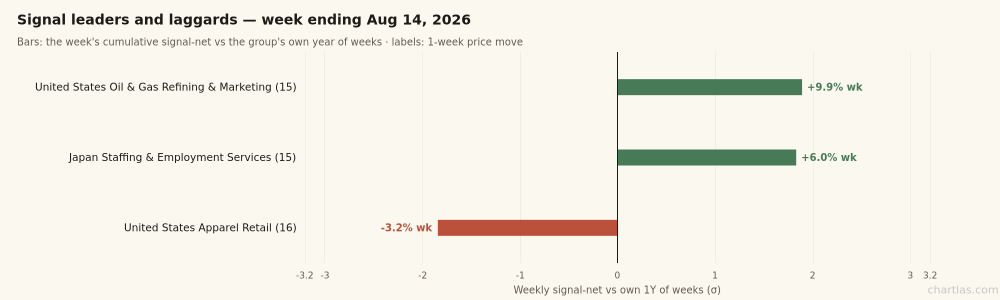
Bars: the week's cumulative signal-net vs the group's own year of weeks. Labels: the same group's 1-week price move.
Signal leaders:
| Industry | Weekly net | σ (1Y wks) | Members | 1W price |
|---|---|---|---|---|
| United States Oil & Gas Refining & Marketing | +102 | +1.9σ | 15 | +9.9% |
| Japan Staffing & Employment Services | +80 | +1.8σ | 15 | +6.0% |
Signal laggards:
| Industry | Weekly net | σ (1Y wks) | Members | 1W price |
|---|---|---|---|---|
| United States Apparel Retail | -63 | -1.8σ | 16 | -3.2% |
The read. The strongest surge has trend-family confirmation: United States Oil & Gas Refining & Marketing logged 121 bullish signals this week, 87 of them trend-type (breakouts, structure, moving-average confirmations) against 31 oversold-type. That is a rally the engine is confirming, not bottom-fishing.
On the bear side the composition inverts: of United States Apparel Retail's 73 bearish fires this week, 34 were trend-family breakdowns. The downtrend is intact and broadening.
Rotation & Divergences
Structural flags from the CHRT tree this week.
2 divergence flags tripped this week (2 hidden-base), but no cross-regional cluster — no sector set off the same flag in two or more regions, which is the coincidence we treat as signal.
Leadership changes worth noting (which industry drives its group's signal activity): - Latin America Basic Materials — Latin America Construction Materials took the lead from Latin America Metals & Mining (08-11). - United States Industrial Equipment — United States Metal Fabrication took the lead from United States Electrical Equipment & Parts (08-10).
Sharpest single-day surprises: Latin America Communication Services printed a -21 net signal day on 08-11 (-2.7σ); Western Europe Marine Shipping printed a +46 net signal day on 08-13 (+2.7σ) — worth a look if you own the space.
Geography Scan
The week's cumulative signal net per region vs that region's own year of weekly readings, alongside the week's price move.
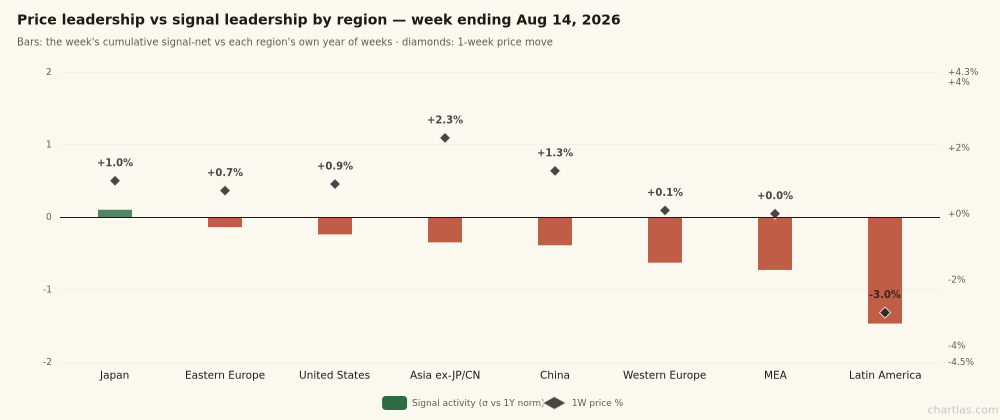
Bars: the week's cumulative signal-net vs each region's own year of weeks. Diamonds: 1-week price move.
| Region | Weekly net | σ (1Y wks) | 1W price |
|---|---|---|---|
| Japan | +1,807 | +0.1σ | +1.0% |
| Eastern Europe | +272 | -0.1σ | +0.7% |
| United States | +735 | -0.2σ | +0.9% |
| Asia ex-JP/CN | +324 | -0.3σ | +2.3% |
| China | -3,192 | -0.4σ | +1.3% |
| Western Europe | -534 | -0.6σ | +0.1% |
| Middle East & Africa | -358 | -0.7σ | +0.0% |
| Latin America | -656 | -1.5σ | -3.0% |
The read: Asia ex-JP/CN is the disagreement worth watching: +2.3% on the week — the best price move of any region — while its signal net finished at +324 (-0.3σ, below its one-year norm). A rally the internals aren't attending is not automatically doomed, but it is the pattern we flag. Latin America is red on both counts: -3.0% with a -1.5σ signal week.
Momentum Breadth
| Index | This Week | Last Week | Change | Z (1Y) | Trend |
|---|---|---|---|---|---|
| Advance / Decline | +2,806 | +20,493 | -17,687 | +0.4 | Deteriorating |
| New 20D High/Low | +8,648 | +8,290 | +358 | +1.1 | Stable |
| MACD Breadth | -257 | +3,838 | -4,095 | -0.1 | Flipped bearish |
| RSI Extremes | -1,269 | -412 | -857 | -0.4 | Weakening |
| Bollinger Band | -3,566 | -2,957 | -609 | -1.0 | Weakening |
| Weekly Movers (±10%) | +9,477 | +14,738 | -5,261 | +1.5 | Deteriorating |
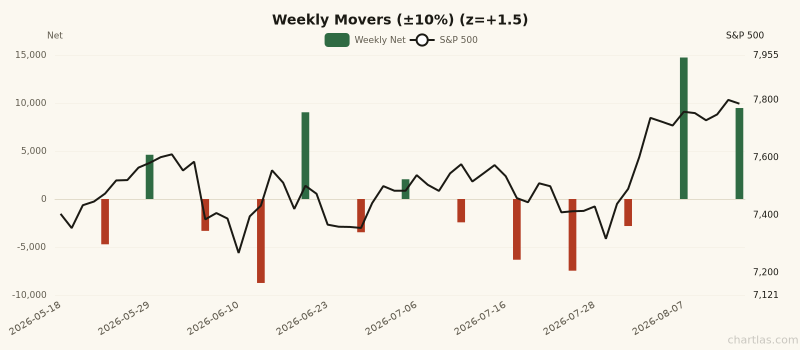
Weekly Movers (±10%) weekly net (bars) with S&P 500 price (right axis). 1Y z-score: +1.5.
Trend Breadth
| Index | This Week | Last Week | Change | Z (1Y) | Trend |
|---|---|---|---|---|---|
| 52-Week High/Low | +1,762 | +2,098 | -336 | -0.2 | Deteriorating |
| Fresh 52W High/Low | +369 | +501 | -132 | -0.1 | Deteriorating |
| 200 DMA Breadth | -12,826 | -18,774 | +5,948 | -1.3 | Improving |
| MA Cross (Golden/Death) | -58 | -114 | +56 | -0.2 | Improving |
| HH/HL Structure | -695 | -413 | -282 | -1.9 | Weakening |
| Breakout / Breakdown | +738 | +731 | +7 | -0.0 | Stable |
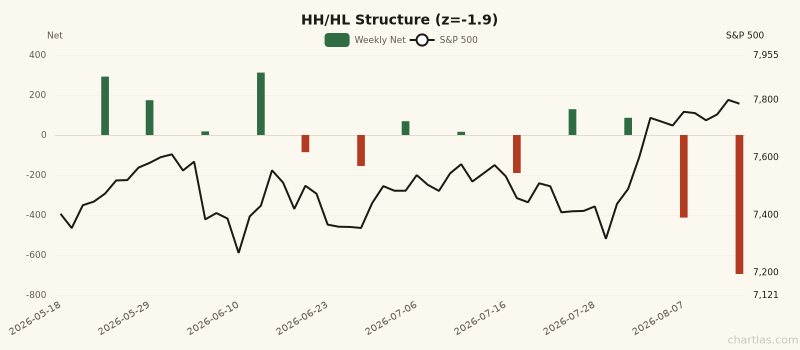
HH/HL Structure weekly net (bars) with S&P 500 price (right axis). 1Y z-score: -1.9.
Pattern Breadth
| Index | This Week | Last Week | Change | Z (1Y) | Trend |
|---|---|---|---|---|---|
| Double Top/Bottom | +225 | +306 | -81 | +0.6 | Deteriorating |
| Failed Pattern | +199 | +587 | -388 | +1.0 | Deteriorating |
Major ETF Signals
| Ticker | Name | Momentum | Trend | Pattern | Net | Z (1Y) |
|---|---|---|---|---|---|---|
| USO | Oil (USO) | 4↑ | 2↑ 1↓ | — | +5 | +0.8 |
| IWM | Russell 2000 | 1↑ 2↓ | 4↑ | — | +3 | +0.1 |
| EEM | Emerging Markets | 1↑ | 1↑ | — | +2 | -0.1 |
| EFA | EAFE (Dev ex-US) | 1↑ 2↓ | 3↑ | — | +2 | +0.1 |
| EWJ | Japan | 1↑ 2↓ | 3↑ | — | +2 | +0.2 |
| QQQ | NASDAQ 100 | 1↑ | 1↑ | — | +2 | -0.1 |
| TLT | 20+ Year Treasury | 4↑ 1↓ | 1↓ | — | +2 | +0.5 |
| SPY | S&P 500 | 1↑ 1↓ | 1↑ | — | +1 | -0.4 |
| HYG | High Yield Corp | 1↑ 1↓ | — | — | +0 | -0.2 |
| VGK | FTSE Europe | — | — | — | +0 | — |
| DIA | Dow Jones | 1↓ | — | — | -1 | -0.6 |
| GLD | Gold | 1↑ 3↓ | — | — | -2 | -0.9 |
| IBIT | Bitcoin | 1↓ | 1↓ | — | -2 | -0.2 |
Nothing on the ETF board is stretched beyond two standard deviations of its own one-year norm this week.
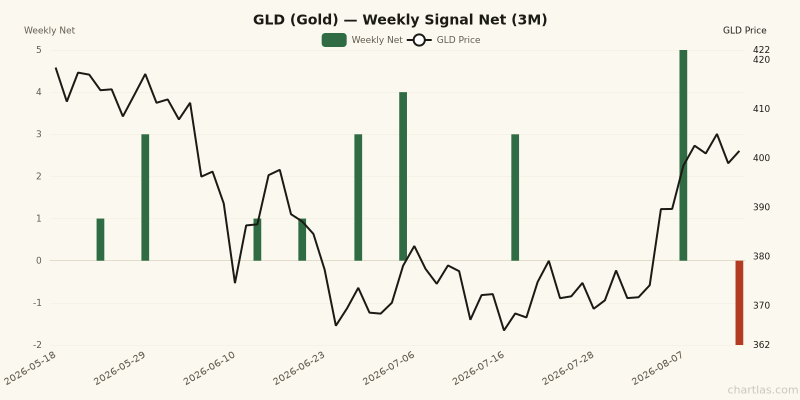
GLD weekly net signals (bars) with GLD price (blue line, right axis). 1Y z-score: -0.9.
Sector Breadth (Advance/Decline)
| Sector | Net | % Bullish | Z (1Y) |
|---|---|---|---|
| Technology | +1,204 | 53.6% | +0.6 |
| Energy | +609 | 59.9% | +1.4 |
| Industrials | +542 | 51.2% | +0.3 |
| Healthcare | +346 | 51.6% | +0.5 |
| Financial Services | +339 | 51.5% | +0.1 |
| Consumer Cyclical | +114 | 50.4% | +0.3 |
| Communication Services | +62 | 50.8% | +0.4 |
| Utilities | -68 | 48.8% | -0.3 |
| Real Estate | -98 | 49.2% | -0.1 |
| Basic Materials | -219 | 49.1% | -0.1 |
| Consumer Defensive | -238 | 48.2% | -0.1 |
No sector's advance/decline week stands out against its own year — rotation, not conviction.
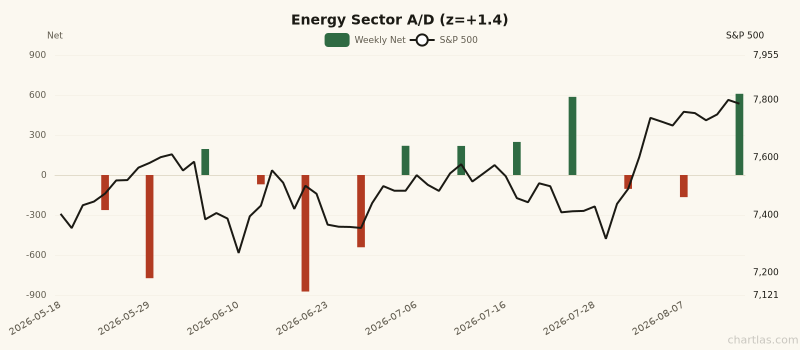
Energy sector weekly A/D net with S&P 500 price (right axis). 1Y z-score: +1.4.
What to Watch Next Week
- Asia ex-JP/CN's internals. A positive signal week would validate the price move; another negative one deepens the flag.
- MACD Breadth at -257 — the closest breadth index to a sign flip. The side it lands on next week is information.
- The confirmed rallies (Japan and United States groups, +6% to +10% price weeks): whether trend-family confirmation persists, or the moves digest.
Last Week We Said
From our report of Aug 7, 2026:
- 🟡 S&P 500: Rallied +3.6% to 7,758, but breadth is not fully confirming. Price is moving up while internals remain mixed.
- 🟢 MSCI World (ACWI): Gained +3.2%, tracking US markets. The rally is global.
- 🟢 The week's bullish theme is Asia ex-JP/CN. 5 of the top 8 industry surges are Asia ex-JP/CN groups with +7% to +14% price weeks.
Last week's report leaned bullish (2 green, 3 amber, 0 red). What happened: the S&P moved +0.4%. Mixed week, mixed call — no point claimed either way. The tally continues next week.
Generated by Chartlas — equity screening & signal alerts for discretionary investors. Forward-return references are averages from our 2015–2026 backtest on ~31,000 securities; they are tendencies, not predictions. Full methodology on the Regime and Breadth pages. Not investment advice.
Get this report in your inbox every Saturday
Free for all Chartlas users. Plus daily signal alerts, custom screens, PDF exports, and live breadth/regime dashboards.
Create free account →